
The numbers are in, and they aren’t pretty for homeowners in some parts of Georgia. With winter driving rodents indoors in search of warmth and food, rodent infestations are now front and center. Here’s what you need to know about which Georgia counties are struggling most with rat and mouse infestations—and why.
🐀 What’s Happening: According to a study by Clinch, Rodent infestations are a significant issue in homes across Georgia. Taliaferro County leads the state with 27.4% of homes reporting rodent problems. That’s more than three times higher than the state average of 8.3%. Other top offenders include Glascock County (27.1%) and Calhoun County (26.8%).
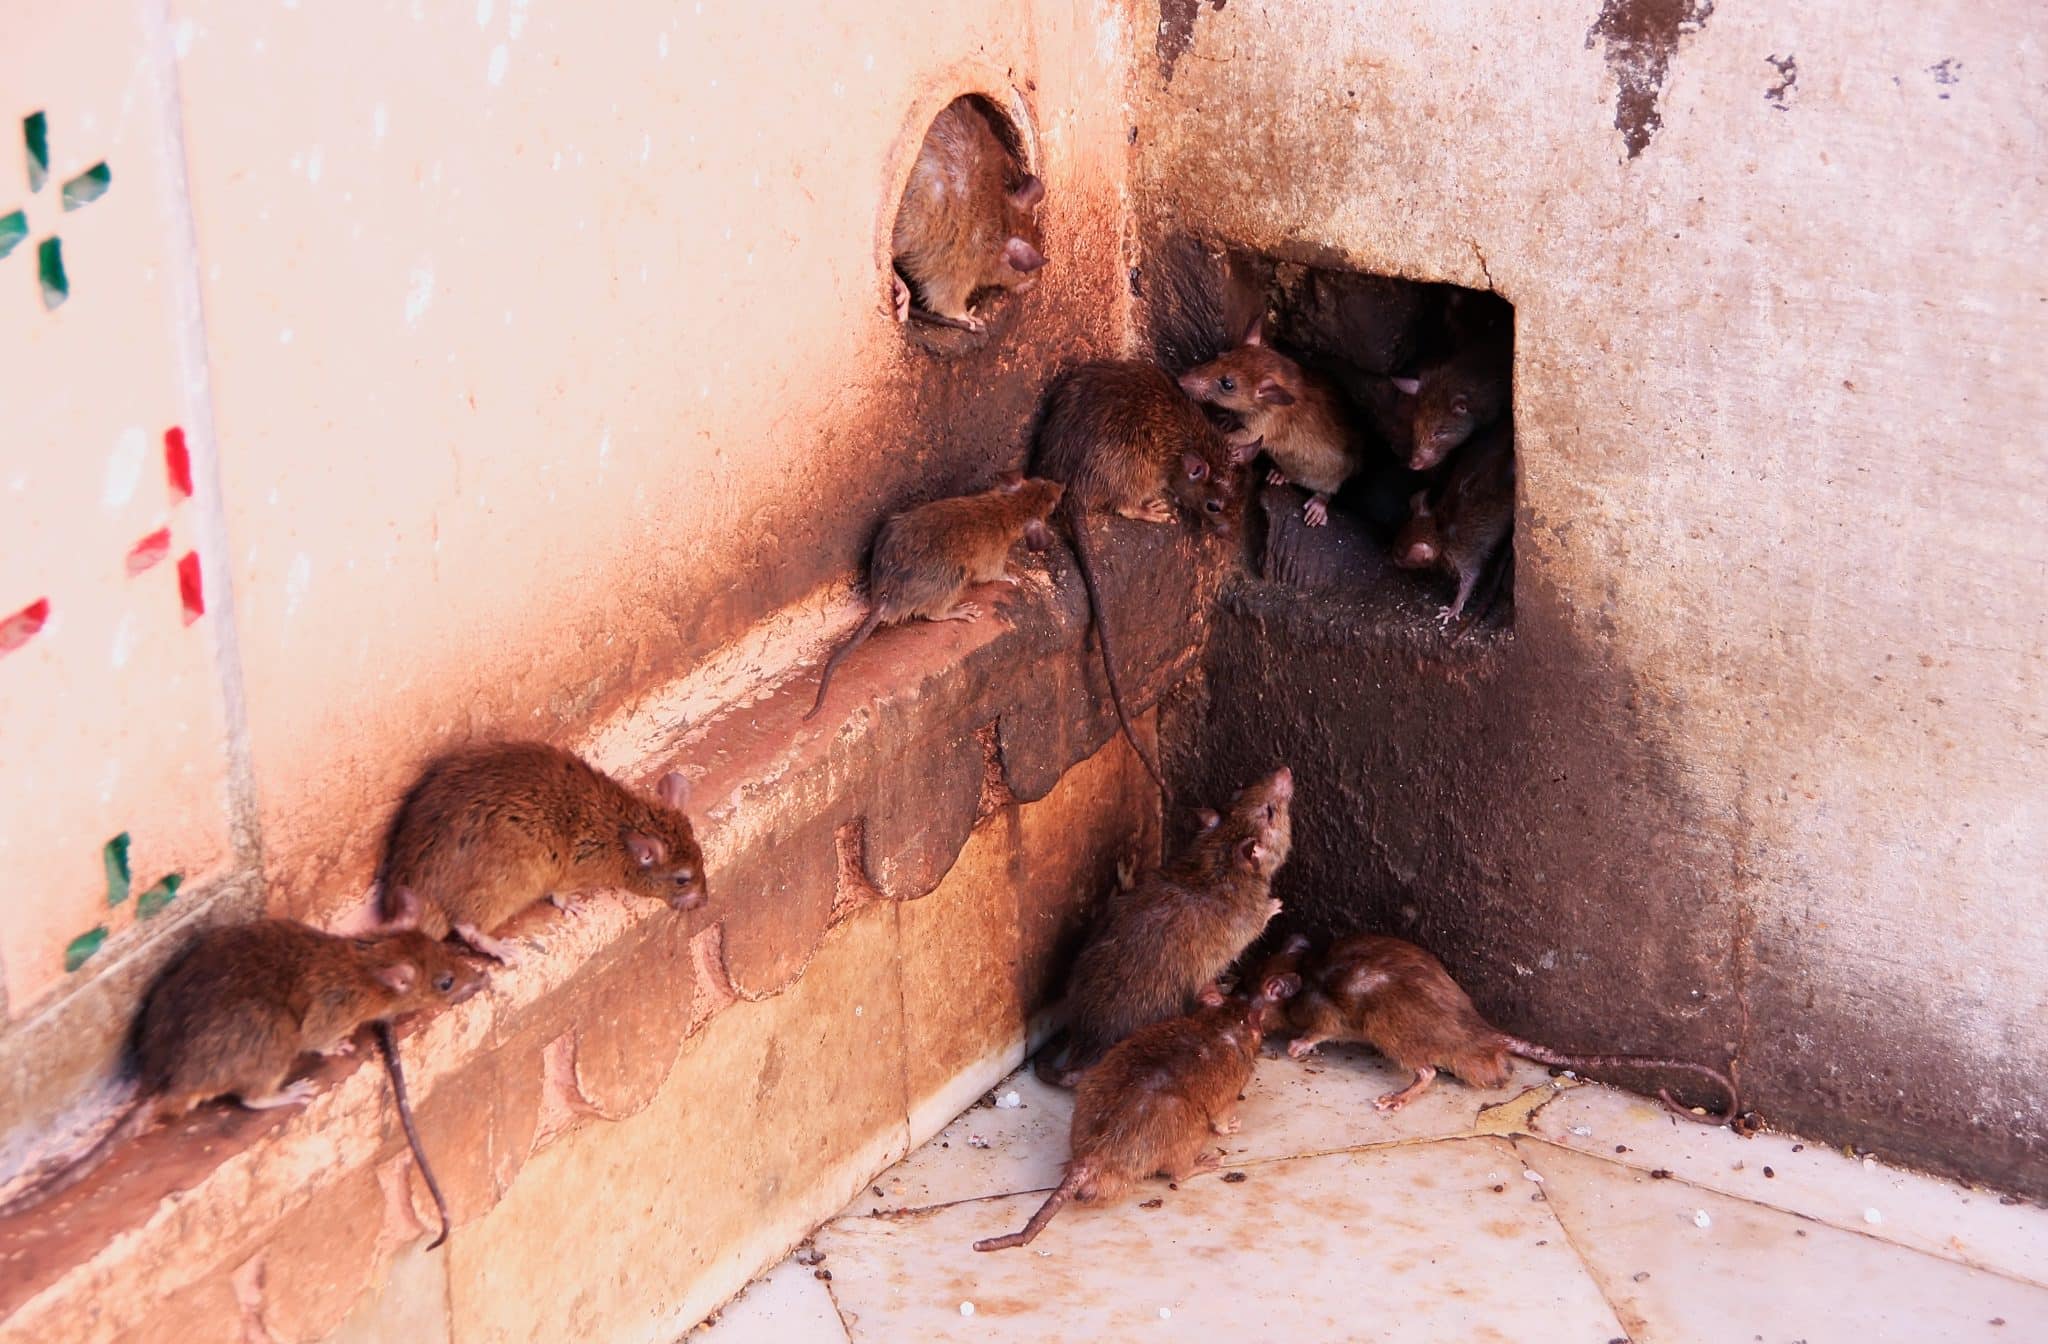
❗Why It Matters: Rodents do more than make noise in the walls. They carry diseases like hantavirus and salmonella, and their presence can worsen asthma and allergies—particularly in children. Beyond health concerns, rats and mice cause structural damage to homes by chewing through wires, walls, and insulation.
The Centers for Disease Control and Prevention cites rodents as a growing public health issue, especially as infestations rise during colder months. Homeowners in areas with older housing stock or rural landscapes are hit hardest.
🔧 Why You Should Pay Attention: Counties with older homes and rural settings report the highest rodent activity. For example:
- Taliaferro County’s median home was built in 1975, and no part of the population lives in urbanized areas.
- Glascock and Calhoun Counties follow similar patterns, with no urban population and median home ages predating 1990.
Urbanization trends also play a role. Surprisingly, counties with higher urban populations like Fulton and Cobb report far fewer infestations due to modern, sealed housing and multi-unit buildings that offer fewer access points for rodents.
🏡 Where Does Your County Stand? The state’s average is 8.3% of homes experiencing rodent problems, equating to over 365,000 homes and nearly 900,000 Georgians living in rodent-affected households.
- Low-risk areas: Counties with modern homes and warmer climates, such as coastal or southern Georgia, see significantly lower infestation rates.
- High-risk areas: Counties with older homes and cold winters—a perfect storm for mice and rats seeking shelter.
🔒 Take Action: Experts recommend homeowners take steps to rodent-proof their homes:
- Seal entry points: Check for gaps around windows, doors, and pipes.
- Clean thoroughly: Keep food in airtight containers and promptly clean up crumbs.
- Trim vegetation: Remove shrubs or debris near home foundations to eliminate hiding spots.
- Call the pros: Pest control services can help manage serious infestations and prevent further damage.
By The Numbers: Here is the full list of county rankings for Georgia.
| Rank | County | % of Homes with Rodents | Homes with rodents | Median year home built |
|---|---|---|---|---|
| 1 | Taliaferro | 27.40% | 281 | 1975 |
| 2 | Glascock | 27.10% | 418 | 1988 |
| 3 | Calhoun | 26.80% | 645 | 1977 |
| 4 | Atkinson | 26.30% | 925 | 1991 |
| 5 | Schley | 25.20% | 561 | 1993 |
| 6 | Wilcox | 23.00% | 813 | 1978 |
| 7 | Wheeler | 22.90% | 603 | 1982 |
| 8 | Stewart | 22.70% | 532 | 1984 |
| 9 | Echols | 21.80% | 349 | 1990 |
| 10 | Twiggs | 20.60% | 883 | 1985 |
| 11 | Madison | 20.50% | 2,466 | 1990 |
| 12 | Pike | 20.40% | 1,463 | 1993 |
| 13 | Heard | 20.40% | 1,073 | 1984 |
| 14 | Clinch | 20.10% | 608 | 1979 |
| 15 | Banks | 19.70% | 1,543 | 1992 |
| 16 | Baker | 19.70% | 328 | 1978 |
| 17 | Wilkinson | 19.60% | 884 | 1983 |
| 18 | Long | 19.40% | 1,389 | 1998 |
| 19 | Warren | 19.30% | 575 | 1979 |
| 20 | Franklin | 18.60% | 2,005 | 1989 |
| 21 | Johnson | 18.50% | 762 | 1984 |
| 22 | Clay | 18.10% | 385 | 1986 |
| 23 | Oglethorpe | 18.00% | 1,217 | 1988 |
| 24 | Marion | 17.90% | 760 | 1993 |
| 25 | Irwin | 17.90% | 734 | 1981 |
| 26 | Meriwether | 17.80% | 1,791 | 1984 |
| 27 | Screven | 17.80% | 1,212 | 1982 |
| 28 | Jefferson | 17.60% | 1,284 | 1982 |
| 29 | Miller | 17.60% | 485 | 1978 |
| 30 | Dade | 17.40% | 1,273 | 1988 |
| 31 | Brantley | 17.30% | 1,421 | 1993 |
| 32 | Fannin | 17.20% | 3,048 | 1994 |
| 33 | Morgan | 17.10% | 1,365 | 1994 |
| 34 | Chattahoochee | 17.10% | 570 | 1978 |
| 35 | Crawford | 16.90% | 916 | 1992 |
| 36 | Haralson | 16.50% | 2,086 | 1989 |
| 37 | Lanier | 16.50% | 737 | 1994 |
| 38 | Upson | 16.40% | 1,996 | 1976 |
| 39 | Chattooga | 16.30% | 1,802 | 1977 |
| 40 | Emanuel | 16.30% | 1,615 | 1981 |
| 41 | Lamar | 16.30% | 1,253 | 1987 |
| 42 | Terrell | 16.30% | 680 | 1975 |
| 43 | Elbert | 16.20% | 1,564 | 1979 |
| 44 | Webster | 16.20% | 250 | 1989 |
| 45 | Wilkes | 16.10% | 830 | 1976 |
| 46 | Montgomery | 16.10% | 643 | 1990 |
| 47 | Talbot | 15.90% | 547 | 1989 |
| 48 | Monroe | 15.50% | 1,756 | 1995 |
| 49 | Greene | 15.50% | 1,620 | 1996 |
| 50 | Jasper | 15.50% | 1,018 | 1990 |
| 51 | Early | 15.50% | 773 | 1984 |
| 52 | Butts | 15.30% | 1,452 | 1994 |
| 53 | Bacon | 15.30% | 738 | 1984 |
| 54 | Harris | 15.20% | 2,207 | 1996 |
| 55 | Cook | 15.00% | 1,121 | 1984 |
| 56 | Grady | 14.90% | 1,635 | 1990 |
| 57 | Taylor | 14.90% | 688 | 1986 |
| 58 | Turner | 14.90% | 588 | 1977 |
| 59 | Pickens | 14.70% | 2,082 | 1995 |
| 60 | Burke | 14.70% | 1,490 | 1984 |
| 61 | Berrien | 14.70% | 1,302 | 1989 |
| 62 | Appling | 14.70% | 1,265 | 1984 |
| 63 | Mitchell | 14.60% | 1,329 | 1979 |
| 64 | Colquitt | 14.50% | 2,726 | 1987 |
| 65 | Tattnall | 14.50% | 1,459 | 1986 |
| 66 | Pierce | 14.40% | 1,193 | 1989 |
| 67 | Brooks | 14.40% | 1,131 | 1985 |
| 68 | Rabun | 14.30% | 1,813 | 1987 |
| 69 | Bartow | 14.20% | 6,005 | 1993 |
| 70 | Dodge | 14.20% | 1,401 | 1981 |
| 71 | McDuffie | 14.20% | 1,327 | 1985 |
| 72 | Treutlen | 14.20% | 431 | 1982 |
| 73 | Walker | 14.10% | 4,297 | 1978 |
| 74 | Stephens | 14.10% | 1,775 | 1983 |
| 75 | Wayne | 14.10% | 1,747 | 1988 |
| 76 | Washington | 14.10% | 1,340 | 1982 |
| 77 | Floyd | 14.00% | 5,690 | 1977 |
| 78 | Troup | 14.00% | 4,012 | 1984 |
| 79 | Hart | 14.00% | 1,863 | 1986 |
| 80 | Lincoln | 14.00% | 688 | 1984 |
| 81 | Candler | 14.00% | 672 | 1987 |
| 82 | Polk | 13.90% | 2,387 | 1983 |
| 83 | Gordon | 13.80% | 3,165 | 1986 |
| 84 | Gilmer | 13.70% | 2,387 | 1997 |
| 85 | Bleckley | 13.60% | 723 | 1982 |
| 86 | Jeff Davis | 13.50% | 885 | 1986 |
| 87 | Charlton | 13.50% | 617 | 1986 |
| 88 | Habersham | 13.40% | 2,521 | 1992 |
| 89 | Pulaski | 13.30% | 686 | 1982 |
| 90 | Murray | 13.20% | 2,145 | 1993 |
| 91 | Evans | 13.20% | 632 | 1986 |
| 92 | Spalding | 13.10% | 3,646 | 1984 |
| 93 | Worth | 13.10% | 1,231 | 1986 |
| 94 | Randolph | 13.10% | 536 | 1980 |
| 95 | Telfair | 13.00% | 950 | 1977 |
| 96 | Towns | 12.90% | 1,075 | 1994 |
| 97 | Jackson | 12.80% | 3,418 | 2001 |
| 98 | Sumter | 12.60% | 1,743 | 1979 |
| 99 | Union | 12.50% | 1,876 | 1994 |
| 100 | Jones | 12.50% | 1,498 | 1990 |
| 101 | Decatur | 12.30% | 1,503 | 1987 |
| 102 | Macon | 12.30% | 748 | 1979 |
| 103 | Peach | 12.10% | 1,427 | 1986 |
| 104 | Dooly | 12.10% | 755 | 1980 |
| 105 | Jenkins | 11.90% | 505 | 1979 |
| 106 | Ben Hill | 11.80% | 948 | 1981 |
| 107 | Quitman | 11.70% | 243 | 1988 |
| 108 | Toombs | 11.60% | 1,415 | 1984 |
| 109 | Hancock | 11.60% | 628 | 1989 |
| 110 | Lumpkin | 11.50% | 1,590 | 1997 |
| 111 | Crisp | 11.40% | 1,231 | 1983 |
| 112 | Whitfield | 11.30% | 4,561 | 1986 |
| 113 | Tift | 11.30% | 1,918 | 1985 |
| 114 | Effingham | 11.20% | 2,699 | 2001 |
| 115 | Coffee | 11.10% | 1,927 | 1988 |
| 116 | Laurens | 11.00% | 2,369 | 1988 |
| 117 | McIntosh | 11.00% | 1,067 | 1997 |
| 118 | Seminole | 10.80% | 522 | 1980 |
| 119 | Newton | 10.60% | 4,268 | 1998 |
| 120 | Walton | 10.50% | 3,637 | 1997 |
| 121 | Putnam | 10.50% | 1,402 | 1990 |
| 122 | Ware | 10.40% | 1,764 | 1977 |
| 123 | Thomas | 10.30% | 2,146 | 1986 |
| 124 | Oconee | 10.20% | 1,529 | 1996 |
| 125 | Catoosa | 10.10% | 2,801 | 1992 |
| 126 | Carroll | 10.00% | 4,606 | 1991 |
| 127 | Bulloch | 9.80% | 3,116 | 1994 |
| 128 | Dawson | 9.80% | 1,191 | 1997 |
| 129 | Dougherty | 9.70% | 3,942 | 1975 |
| 130 | White | 9.60% | 1,577 | 1994 |
| 131 | Baldwin | 9.40% | 1,945 | 1986 |
| 132 | Bibb | 9.10% | 6,395 | 1976 |
| 133 | Richmond | 8.70% | 7,795 | 1980 |
| 134 | Coweta | 8.50% | 4,819 | 1998 |
| 135 | Barrow | 8.40% | 2,509 | 2000 |
| 136 | Lowndes | 8.30% | 4,086 | 1992 |
| 137 | Hall | 8.10% | 6,181 | 1995 |
| 138 | Muscogee | 7.90% | 6,763 | 1978 |
| 139 | Douglas | 7.70% | 4,093 | 1996 |
| 140 | Camden | 7.50% | 1,702 | 1994 |
| 141 | Glynn | 7.40% | 3,268 | 1987 |
| 142 | Clarke | 7.30% | 3,922 | 1987 |
| 143 | Bryan | 7.30% | 1,108 | 2004 |
| 144 | Rockdale | 7.10% | 2,407 | 1988 |
| 145 | Chatham | 6.70% | 8,484 | 1985 |
| 146 | Houston | 6.50% | 4,249 | 1994 |
| 147 | Paulding | 6.50% | 3,851 | 2001 |
| 148 | Lee | 6.50% | 747 | 1998 |
| 149 | Cherokee | 5.90% | 5,771 | 2000 |
| 150 | Columbia | 5.80% | 3,447 | 1998 |
| 151 | Liberty | 5.80% | 1,679 | 1993 |
| 152 | Clayton | 5.30% | 5,639 | 1988 |
| 153 | DeKalb | 5.10% | 16,215 | 1983 |
| 154 | Cobb | 5.00% | 15,254 | 1989 |
| 155 | Forsyth | 4.70% | 4,128 | 2004 |
| 156 | Henry | 4.70% | 3,045 | 2000 |
| 157 | Gwinnett | 4.10% | 13,010 | 1995 |
| 158 | Fulton | 4.00% | 19,688 | 1992 |
| 159 | Fayette | 4.00% | 1,746 | 1993 |

B.T. Clark
B.T. Clark is an award-winning journalist and the Publisher of The Georgia Sun. He has 25 years of experience in journalism and served as Managing Editor of Neighbor Newspapers in metro Atlanta for 15 years and Digital Director at Times-Journal Inc. for 8 years. His work has appeared in several newspapers throughout the state including Neighbor Newspapers, The Cherokee Tribune and The Marietta Daily Journal. He is a Georgia native and a fifth-generation Georgian.