
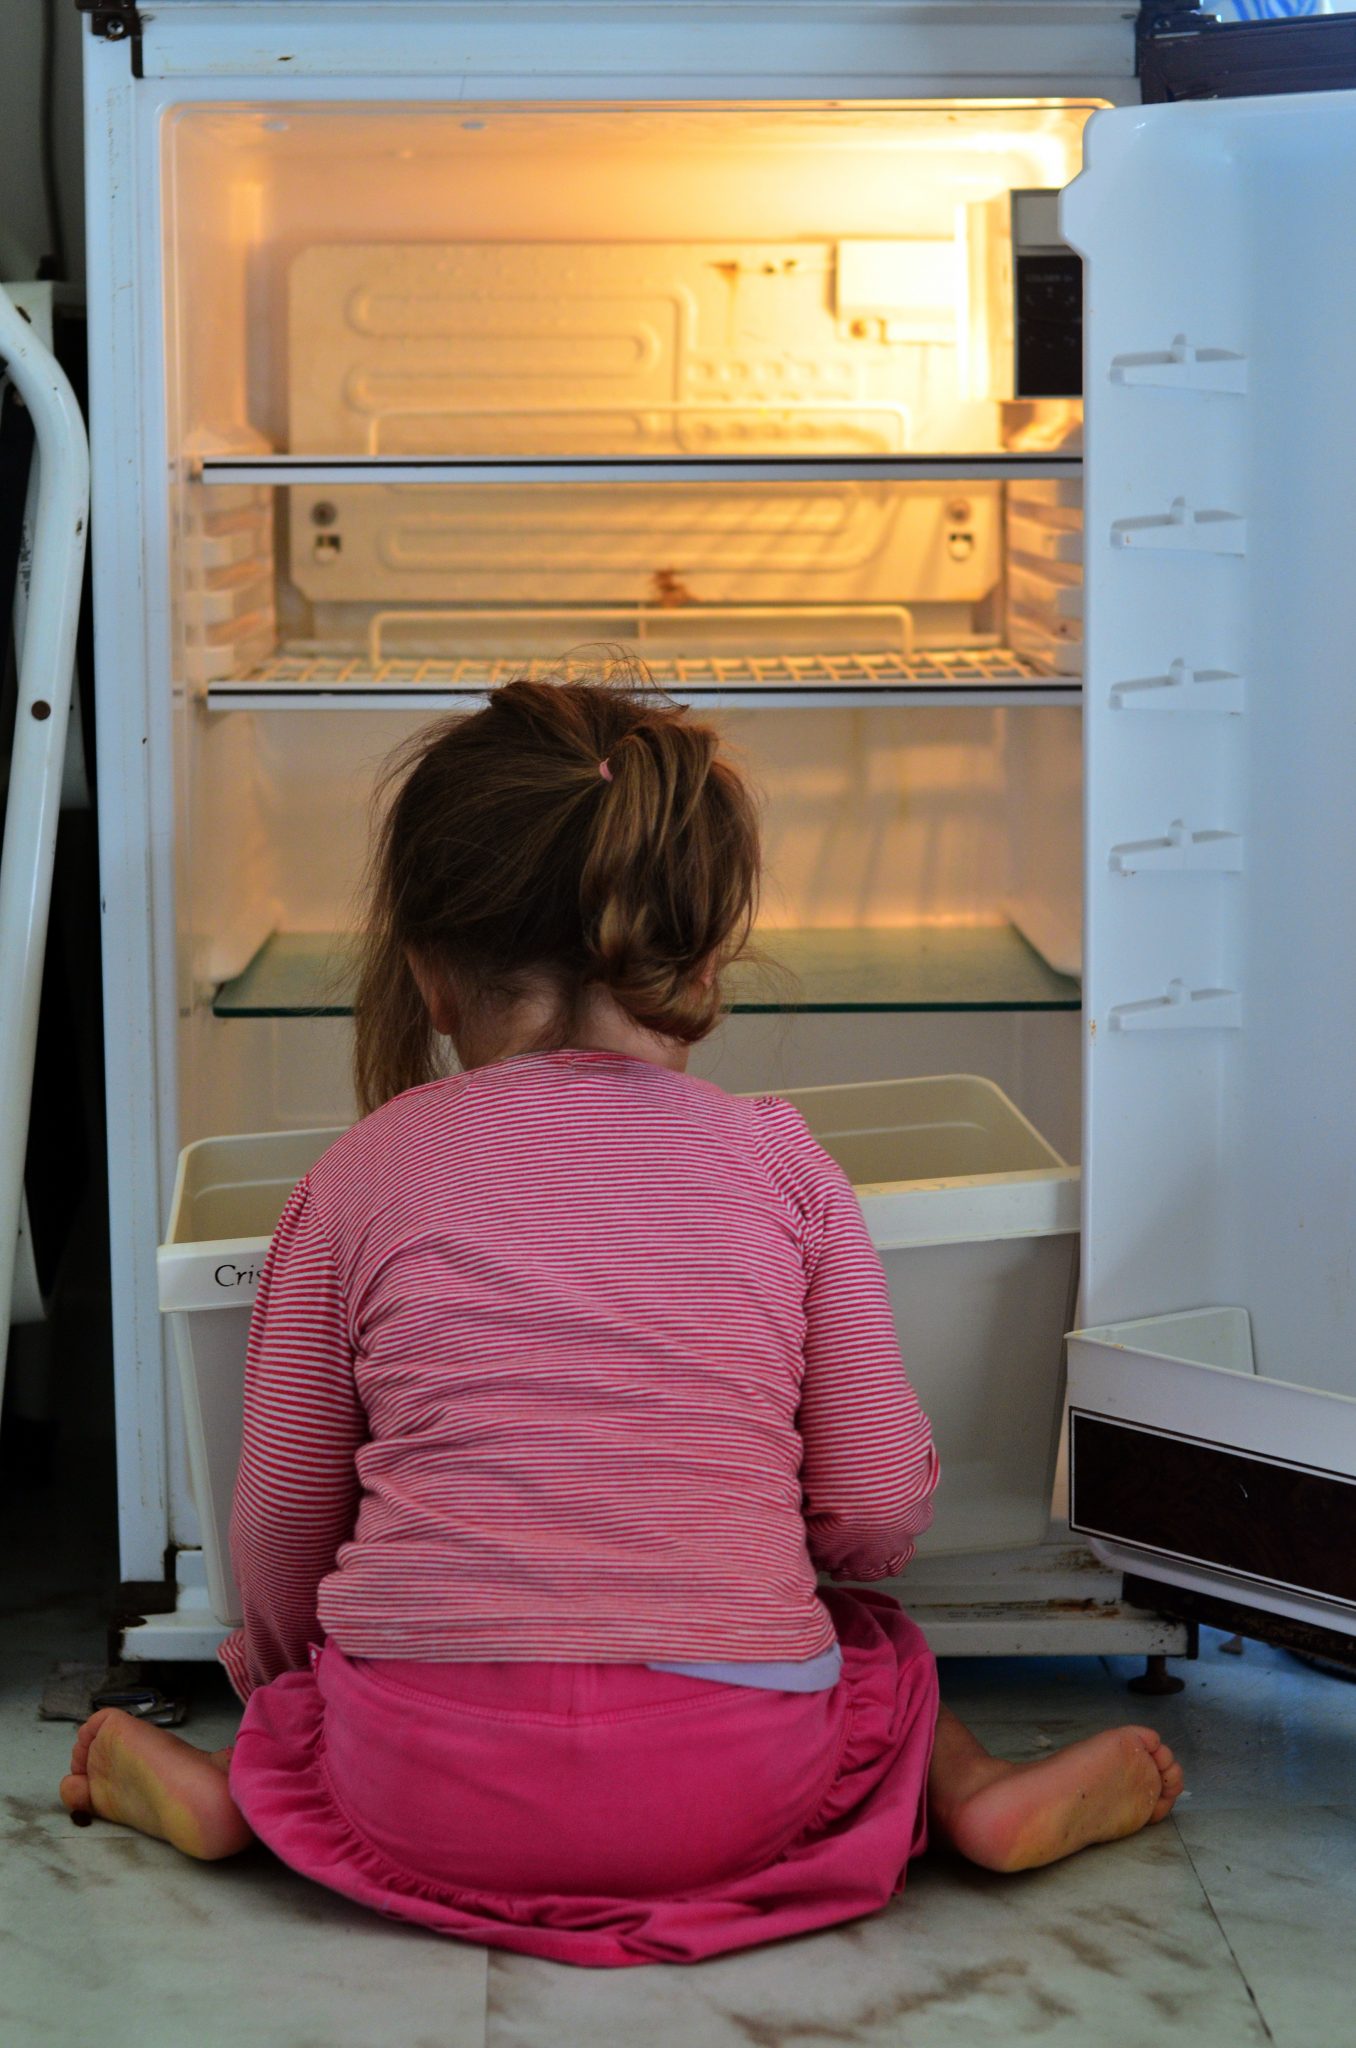
Food insecurity is a widespread problem in the United States, with people experiencing food insecurity in every single county in the nation. The nonprofit Feeding America describes food insecurity as “a lack of consistent access to enough food for every person in a household to live an active, healthy life.”
Food insecurity hits children particularly hard. The USDA estimates that more than 5.5 million children lived in food-insecure households in 2021. Not having consistent access to enough food can affect cognitive abilities, overall health, moods, and attention spans—not to mention the psychological effects of living with scarcity.
Stacker compiled a list of counties in Georgia with the highest rate of food insecure children using data from Feeding America. Counties are ranked by highest percent of children with food insecurity as of 2020. Georgia has a child food insecurity rate of 14.4%, which ranks #23 highest among all states.
States with the highest rate of food insecure children
#1. Louisiana: 21.5%
#2. New Mexico: 20.5%
#3. Mississippi: 20.4%
#4. Alabama: 19.8%
#5. Arkansas: 19.7%
States with the lowest rate of food insecure children
#1. North Dakota: 8.1%
#2. Massachusetts: 8.8%
#3. New Jersey: 9.0%
#4. Minnesota: 9.3%
#5. New Hampshire: 9.5%
Read on to see where food insecurity is most prevalent in Georgia.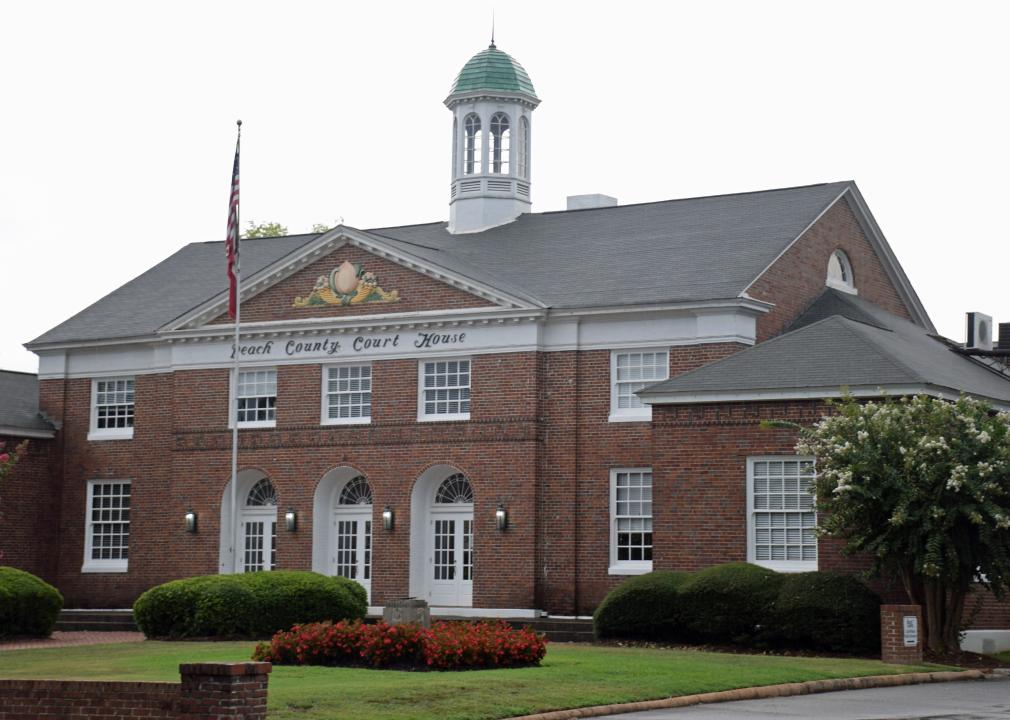
Bubba73 (Jud McCranie) // Wikimedia Commons
#50. Peach County
– Child food insecurity rate: 20.5% (1,170 total)
— 4.4% higher than national average
– Food insecurity rate: 13.7% (3,770 total)
— 1.9% higher than national average
– Annual food budget shortfall: $2,753,000
— Cost per meal: $4.54
Michael Rivera // Wikimedia Commons
#49. Spalding County
– Child food insecurity rate: 20.5% (3,190 total)
— 4.4% higher than national average
– Food insecurity rate: 13.8% (9,140 total)
— 2.0% higher than national average
– Annual food budget shortfall: $4,665,000
— Cost per meal: $3.17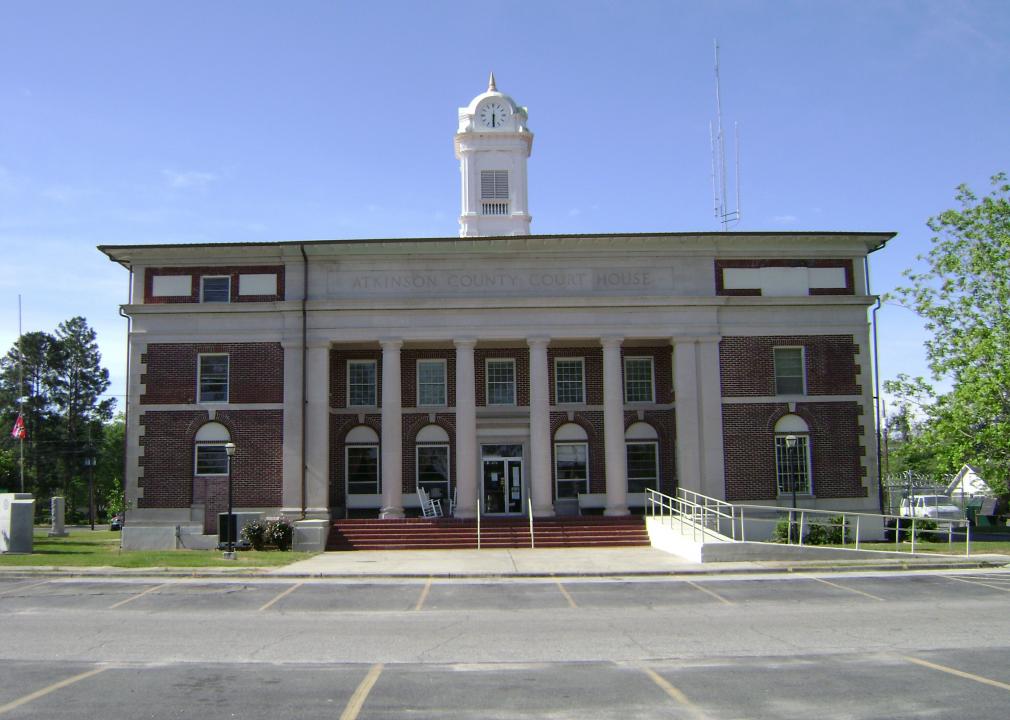
Mjrmtg // Wikimedia Commons
#48. Atkinson County
– Child food insecurity rate: 20.6% (460 total)
— 4.5% higher than national average
– Food insecurity rate: 14.9% (1,230 total)
— 3.1% higher than national average
– Annual food budget shortfall: $595,000
— Cost per meal: $3.00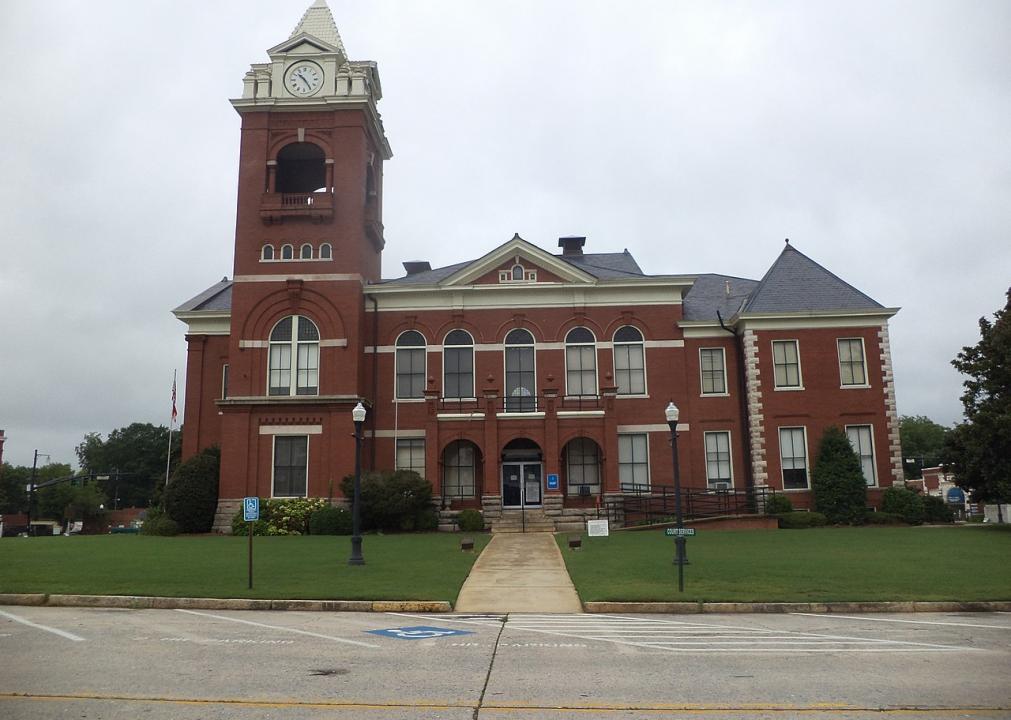
Michael Rivera // Wikimedia Commons
#47. Butts County
– Child food insecurity rate: 20.9% (1,030 total)
— 4.8% higher than national average
– Food insecurity rate: 14.6% (3,560 total)
— 2.8% higher than national average
– Annual food budget shortfall: $1,934,000
— Cost per meal: $3.37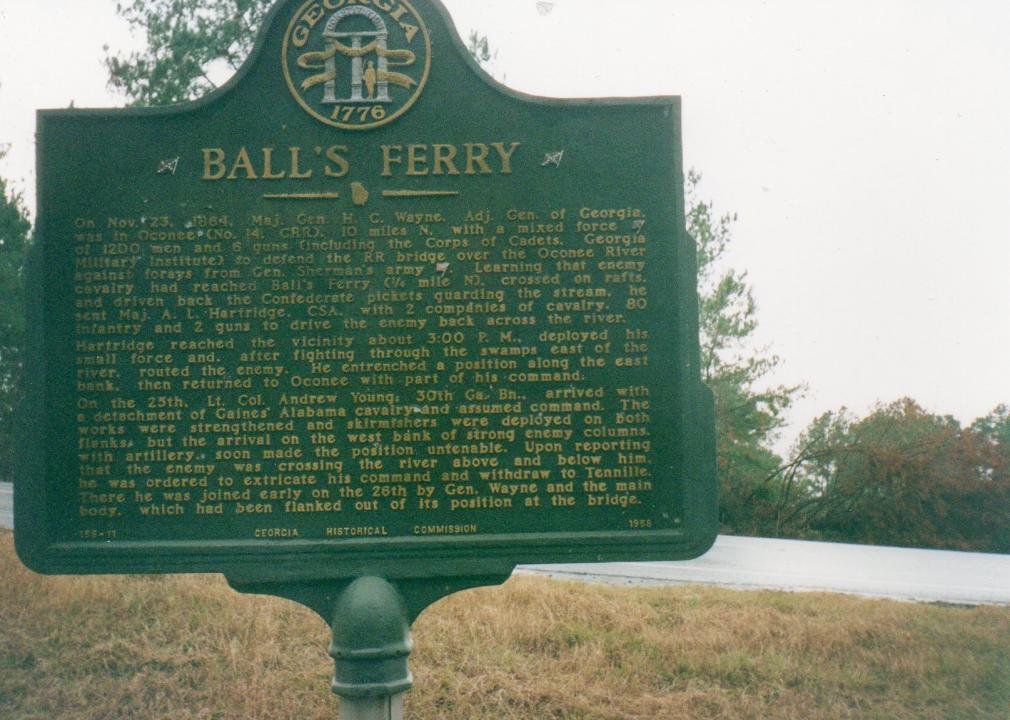
S B Calvert Clariosophic // Wikimedia Commons
#46. Wilkinson County
– Child food insecurity rate: 21.1% (430 total)
— 5.0% higher than national average
– Food insecurity rate: 14.1% (1,260 total)
— 2.3% higher than national average
– Annual food budget shortfall: $646,000
— Cost per meal: $3.18
John Trainor // Wikimedia Commons
#45. Putnam County
– Child food insecurity rate: 21.2% (930 total)
— 5.1% higher than national average
– Food insecurity rate: 13.9% (3,040 total)
— 2.1% higher than national average
– Annual food budget shortfall: $1,448,000
— Cost per meal: $2.96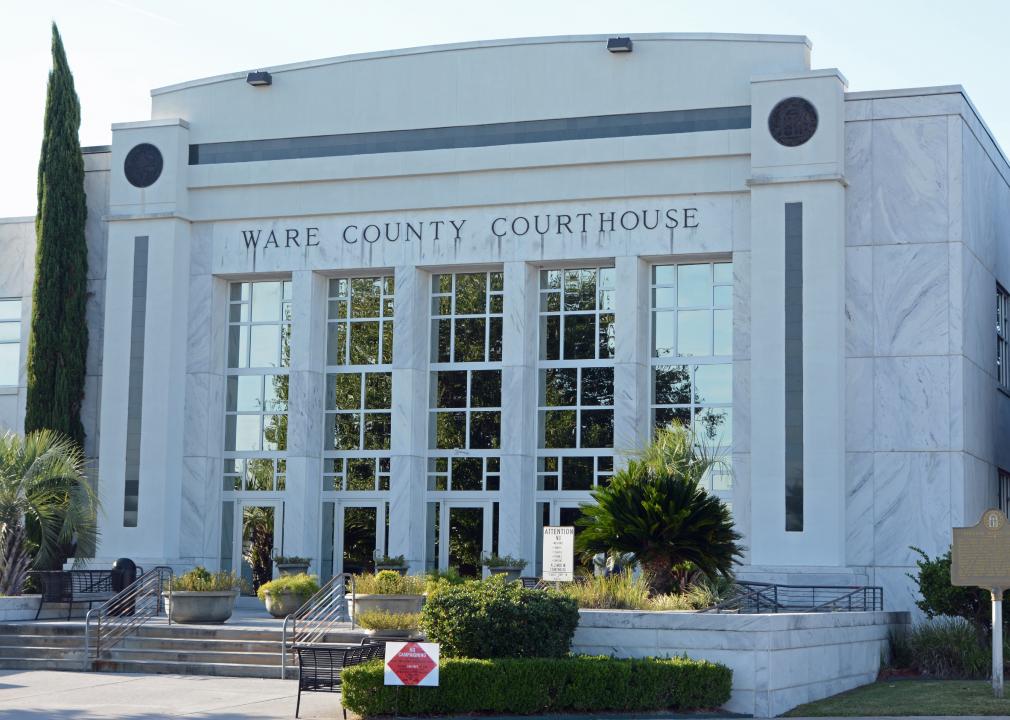
Bubba73 (Jud McCranie) // Wikimedia Commons
#44. Ware County
– Child food insecurity rate: 21.2% (1,830 total)
— 5.1% higher than national average
– Food insecurity rate: 14.9% (5,330 total)
— 3.1% higher than national average
– Annual food budget shortfall: $2,577,000
— Cost per meal: $3.00
Ebyabe // Wikimedia Commons
#43. Brooks County
– Child food insecurity rate: 21.6% (740 total)
— 5.5% higher than national average
– Food insecurity rate: 14.0% (2,170 total)
— 2.2% higher than national average
– Annual food budget shortfall: $1,177,000
— Cost per meal: $3.37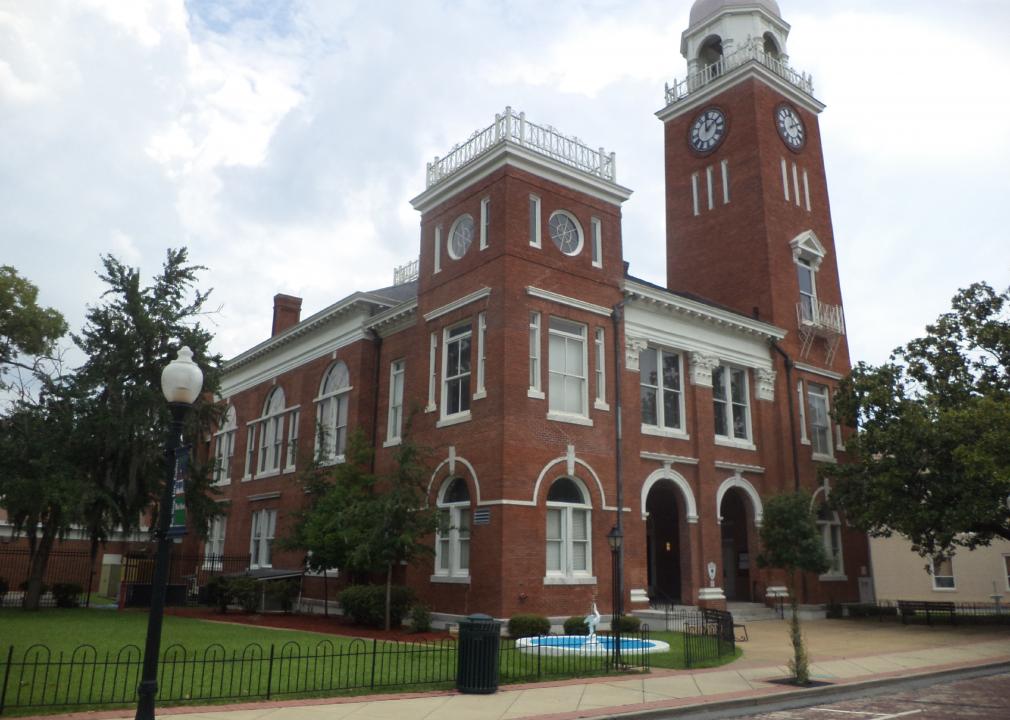
Michael Rivera // Wikimedia Commons
#42. Decatur County
– Child food insecurity rate: 21.6% (1,390 total)
— 5.5% higher than national average
– Food insecurity rate: 14.6% (3,880 total)
— 2.8% higher than national average
– Annual food budget shortfall: $1,969,000
— Cost per meal: $3.15
Canva
#41. Washington County
– Child food insecurity rate: 21.8% (950 total)
— 5.7% higher than national average
– Food insecurity rate: 14.0% (2,840 total)
— 2.2% higher than national average
– Annual food budget shortfall: $1,393,000
— Cost per meal: $3.05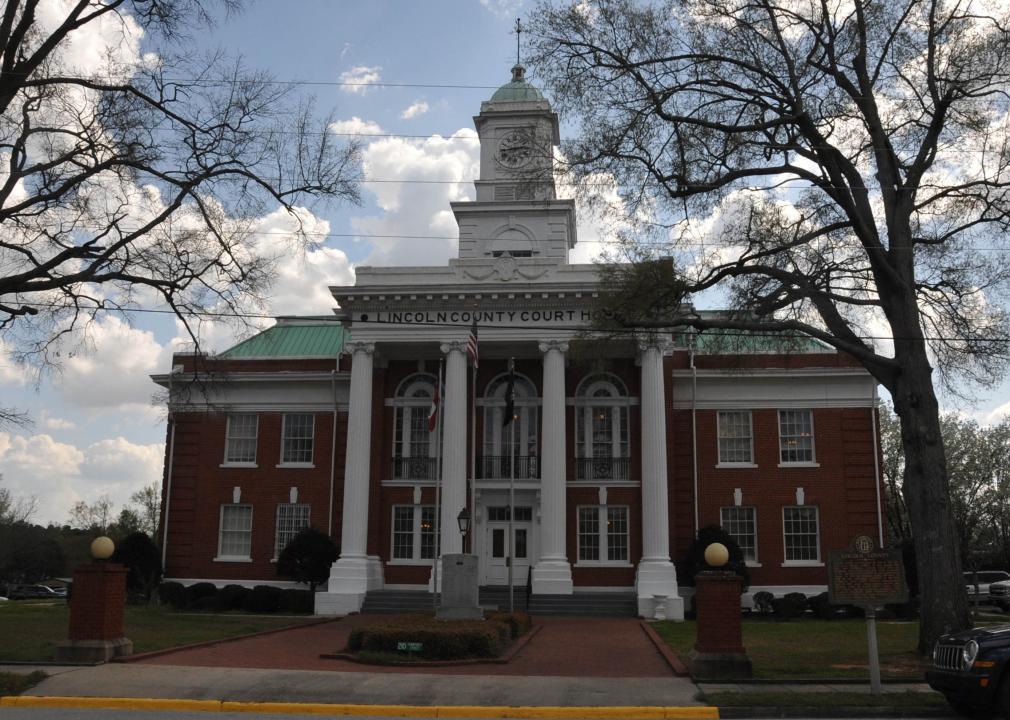
JERRYE & ROY KLOTZ MD // Wikimedia Commons
#40. Lincoln County
– Child food insecurity rate: 22.5% (340 total)
— 6.4% higher than national average
– Food insecurity rate: 13.9% (1,100 total)
— 2.1% higher than national average
– Annual food budget shortfall: $517,000
— Cost per meal: $2.92
Stephen Matthew Milligan // Wikimedia Commons
#39. Baldwin County
– Child food insecurity rate: 22.6% (1,910 total)
— 6.5% higher than national average
– Food insecurity rate: 14.4% (6,470 total)
— 2.6% higher than national average
– Annual food budget shortfall: $3,316,000
— Cost per meal: $3.18
JERRYE & ROY KLOTZ MD // Wikimedia Commons
#38. Pulaski County
– Child food insecurity rate: 22.7% (450 total)
— 6.6% higher than national average
– Food insecurity rate: 14.4% (1,610 total)
— 2.6% higher than national average
– Annual food budget shortfall: $782,000
— Cost per meal: $3.02
Michael Rivera // Wikimedia Commons
#37. Seminole County
– Child food insecurity rate: 22.8% (390 total)
— 6.7% higher than national average
– Food insecurity rate: 17.0% (1,400 total)
— 5.2% higher than national average
– Annual food budget shortfall: $711,000
— Cost per meal: $3.15
Calvin Beale // Wikimedia Commons
#36. Calhoun County
– Child food insecurity rate: 23.0% (250 total)
— 6.9% higher than national average
– Food insecurity rate: 14.1% (890 total)
— 2.3% higher than national average
– Annual food budget shortfall: $459,000
— Cost per meal: $3.21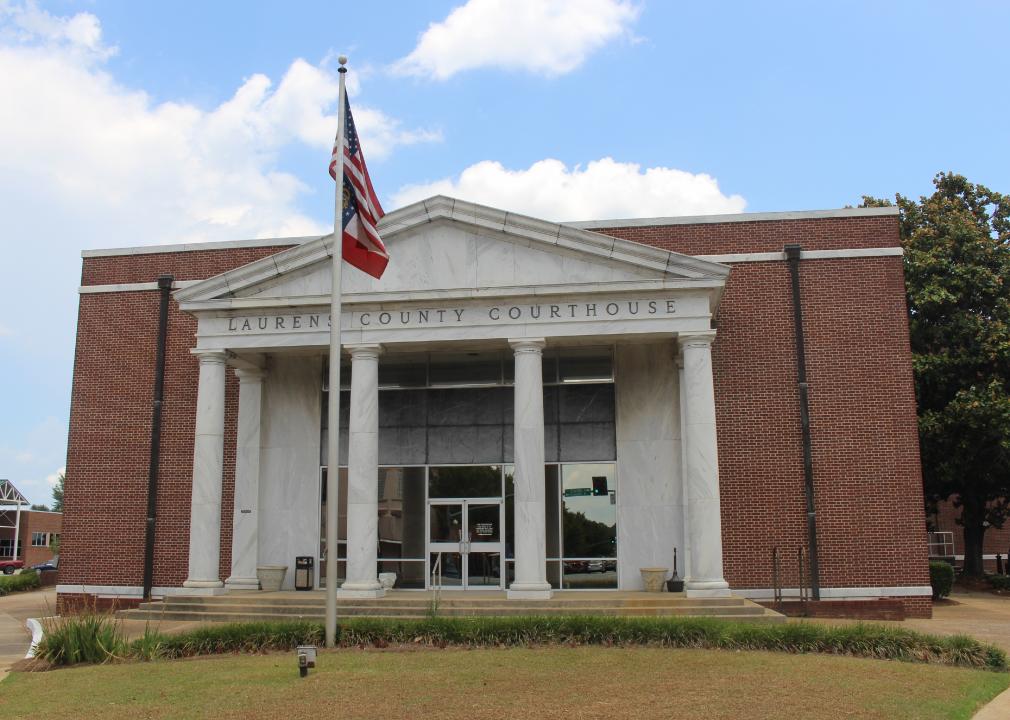
Michael Rivera // Wikimedia Commons
#35. Laurens County
– Child food insecurity rate: 23.2% (2,710 total)
— 7.1% higher than national average
– Food insecurity rate: 16.3% (7,720 total)
— 4.5% higher than national average
– Annual food budget shortfall: $4,031,000
— Cost per meal: $3.24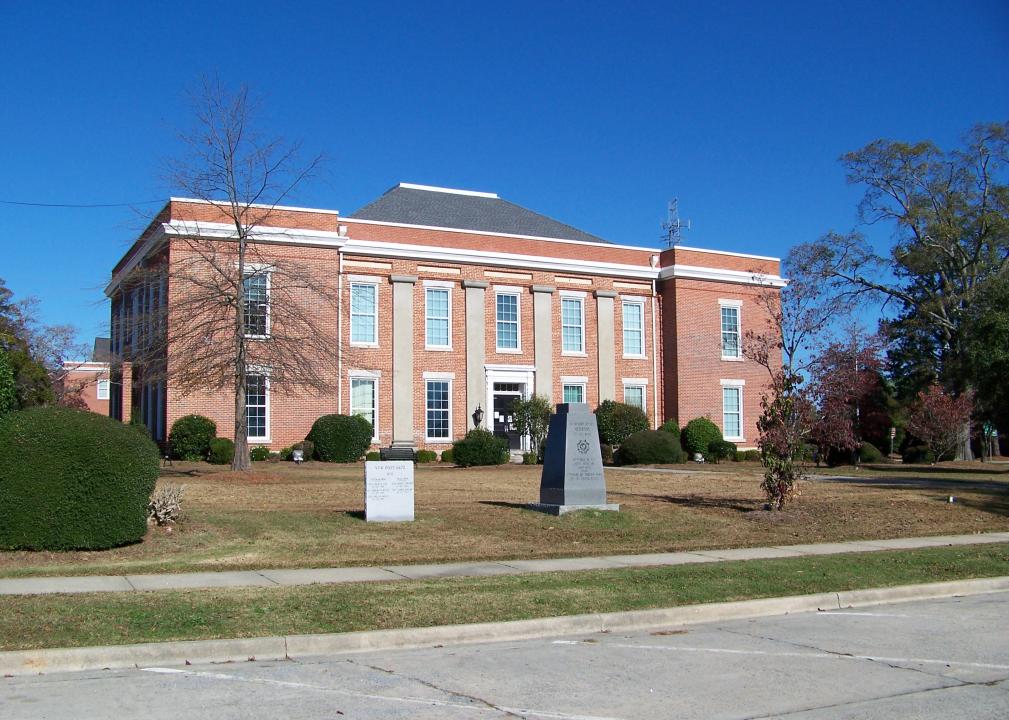
Upstateherd // Wikimedia Commons
#34. McDuffie County
– Child food insecurity rate: 23.3% (1,240 total)
— 7.2% higher than national average
– Food insecurity rate: 13.4% (2,860 total)
— 1.6% higher than national average
– Annual food budget shortfall: $1,344,000
— Cost per meal: $2.92
Canva
#33. Taliaferro County
– Child food insecurity rate: 23.3% (50 total)
— 7.2% higher than national average
– Food insecurity rate: 14.9% (240 total)
— 3.1% higher than national average
– Annual food budget shortfall: $113,000
— Cost per meal: $2.92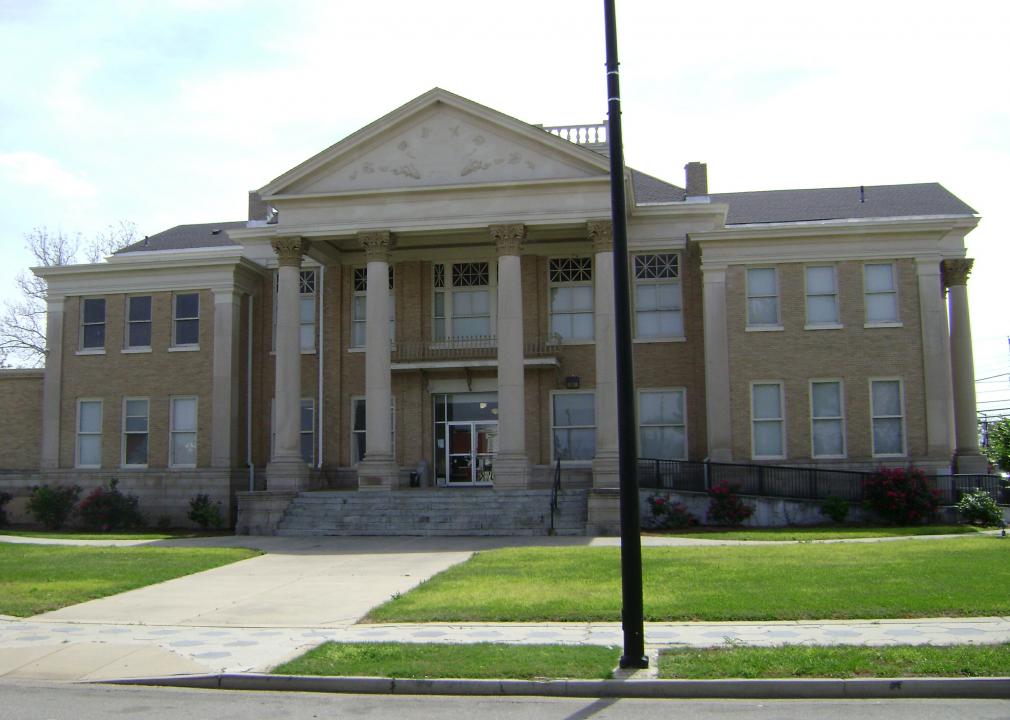
Michael Rivera // Wikimedia Commons
#32. Ben Hill County
– Child food insecurity rate: 23.4% (980 total)
— 7.3% higher than national average
– Food insecurity rate: 17.2% (2,900 total)
— 5.4% higher than national average
– Annual food budget shortfall: $1,540,000
— Cost per meal: $3.30
Rivers Langley; SaveRivers // Wikimedia Commons
#31. Quitman County
– Child food insecurity rate: 23.4% (70 total)
— 7.3% higher than national average
– Food insecurity rate: 12.1% (280 total)
— 0.3% higher than national average
– Annual food budget shortfall: $142,000
— Cost per meal: $3.15
Stephen Matthew Milligan // Wikimedia Commons
#30. Burke County
– Child food insecurity rate: 23.5% (1,380 total)
— 7.4% higher than national average
– Food insecurity rate: 12.4% (2,810 total)
— 0.6% higher than national average
– Annual food budget shortfall: $1,316,000
— Cost per meal: $2.91
Dee Whitlow // Wikimedia Commons
#29. Elbert County
– Child food insecurity rate: 23.5% (980 total)
— 7.4% higher than national average
– Food insecurity rate: 16.2% (3,100 total)
— 4.4% higher than national average
– Annual food budget shortfall: $1,504,000
— Cost per meal: $3.01
Jud McCranie // Wikimedia Commons
#28. Emanuel County
– Child food insecurity rate: 23.5% (1,310 total)
— 7.4% higher than national average
– Food insecurity rate: 16.9% (3,800 total)
— 5.1% higher than national average
– Annual food budget shortfall: $1,709,000
— Cost per meal: $2.79
SaveRivers // Wikimedia Commons
#27. Meriwether County
– Child food insecurity rate: 23.7% (1,070 total)
— 7.6% higher than national average
– Food insecurity rate: 16.4% (3,470 total)
— 4.6% higher than national average
– Annual food budget shortfall: $1,794,000
— Cost per meal: $3.21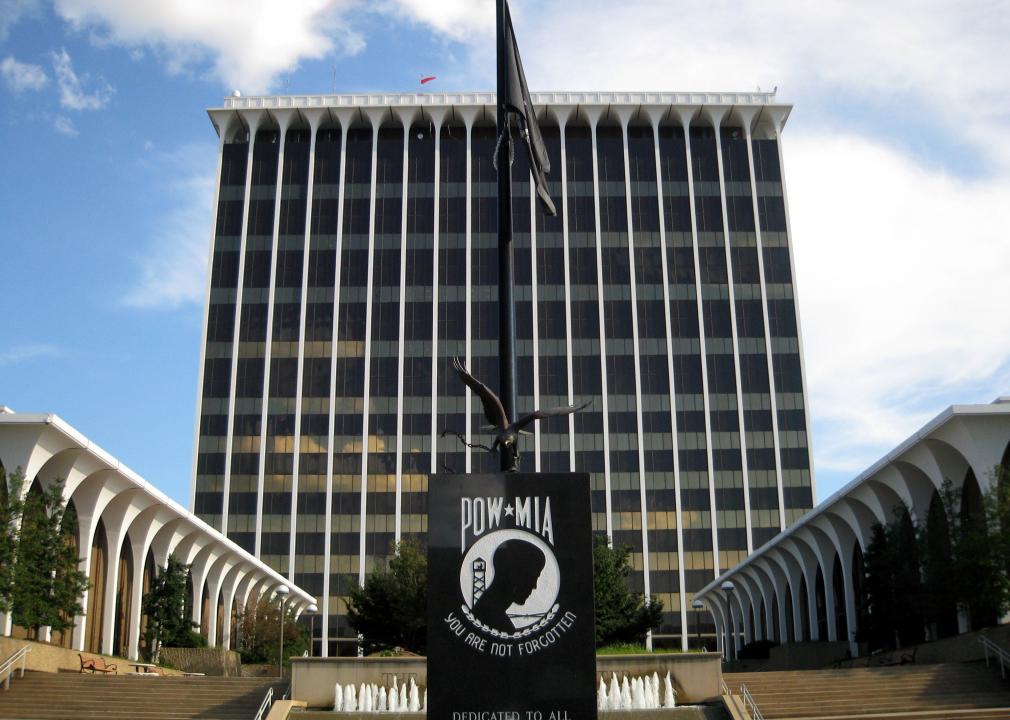
Garydunncolumbusgausa // Wikimedia Commons
#26. Muscogee County
– Child food insecurity rate: 23.9% (11,560 total)
— 7.8% higher than national average
– Food insecurity rate: 15.3% (29,860 total)
— 3.5% higher than national average
– Annual food budget shortfall: $16,364,000
— Cost per meal: $3.40
Blastoids // Wikimedia Commons
#25. Jenkins County
– Child food insecurity rate: 24.0% (450 total)
— 7.9% higher than national average
– Food insecurity rate: 18.3% (1,610 total)
— 6.5% higher than national average
– Annual food budget shortfall: $761,000
— Cost per meal: $2.94
Rivers Langley; SaveRivers // Wikimedia Commons
#24. Talbot County
– Child food insecurity rate: 24.0% (250 total)
— 7.9% higher than national average
– Food insecurity rate: 11.7% (730 total)
— 0.1% lower than national average
– Annual food budget shortfall: $421,000
— Cost per meal: $3.58
Canva
#23. Wilkes County
– Child food insecurity rate: 24.0% (500 total)
— 7.9% higher than national average
– Food insecurity rate: 15.1% (1,480 total)
— 3.3% higher than national average
– Annual food budget shortfall: $695,000
— Cost per meal: $2.92
Rivers Langley; SaveRivers // Wikimedia Commons
#22. Taylor County
– Child food insecurity rate: 24.1% (400 total)
— 8.0% higher than national average
– Food insecurity rate: 19.1% (1,550 total)
— 7.3% higher than national average
– Annual food budget shortfall: $1,143,000
— Cost per meal: $4.58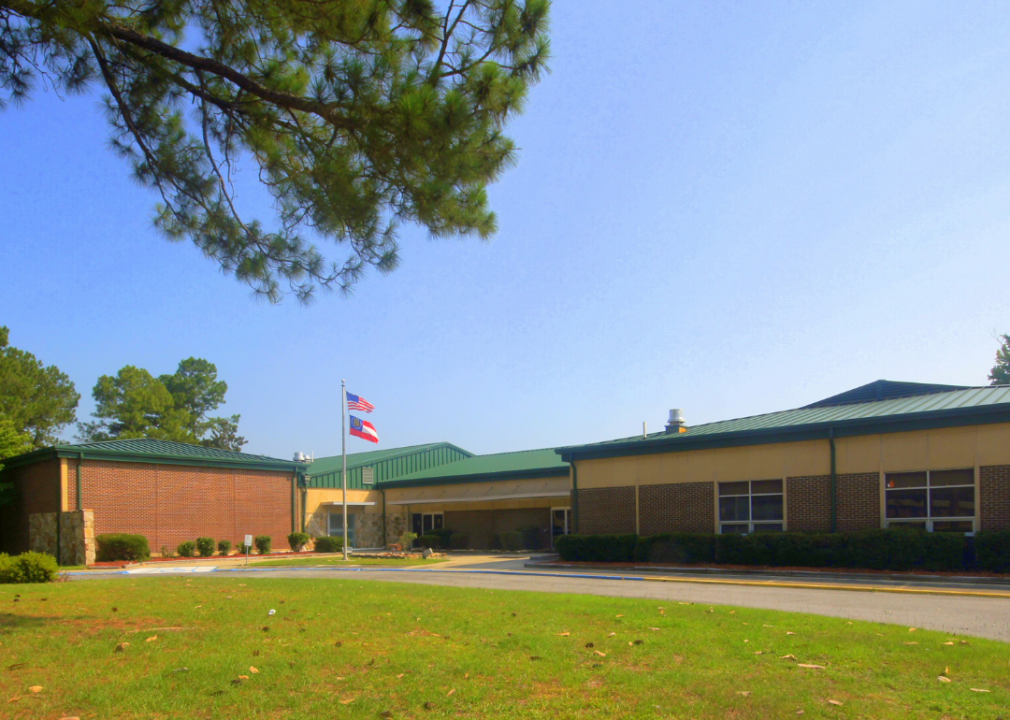
Canva
#21. Screven County
– Child food insecurity rate: 24.6% (720 total)
— 8.5% higher than national average
– Food insecurity rate: 14.6% (2,040 total)
— 2.8% higher than national average
– Annual food budget shortfall: $1,030,000
— Cost per meal: $3.14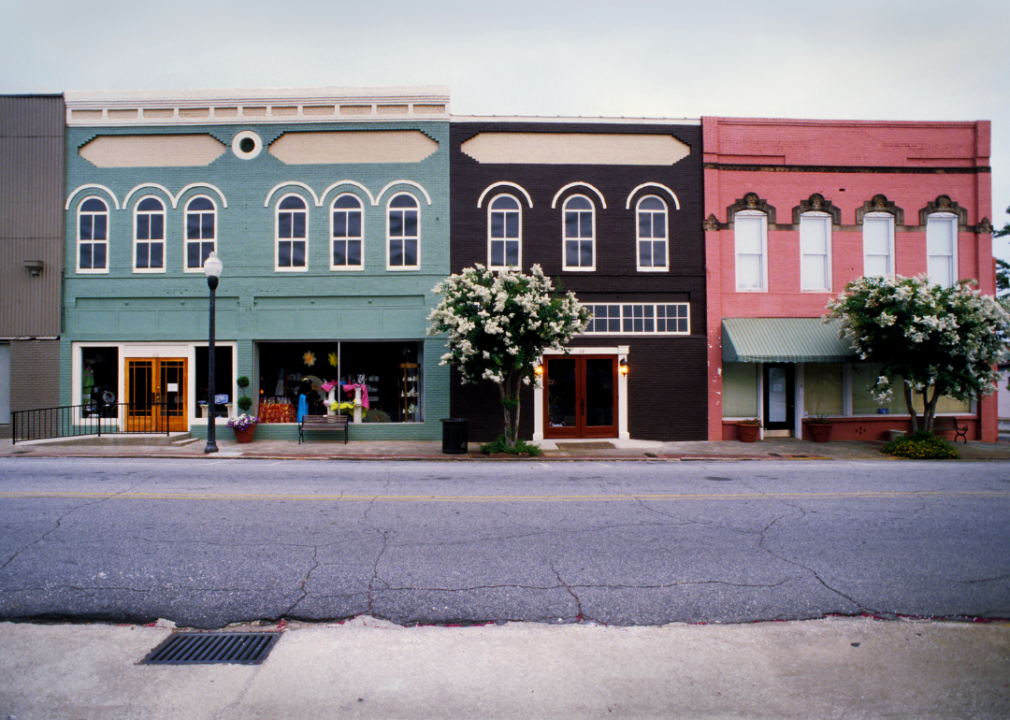
Canva
#20. Sumter County
– Child food insecurity rate: 25.3% (1,700 total)
— 9.2% higher than national average
– Food insecurity rate: 14.6% (4,350 total)
— 2.8% higher than national average
– Annual food budget shortfall: $2,478,000
— Cost per meal: $3.54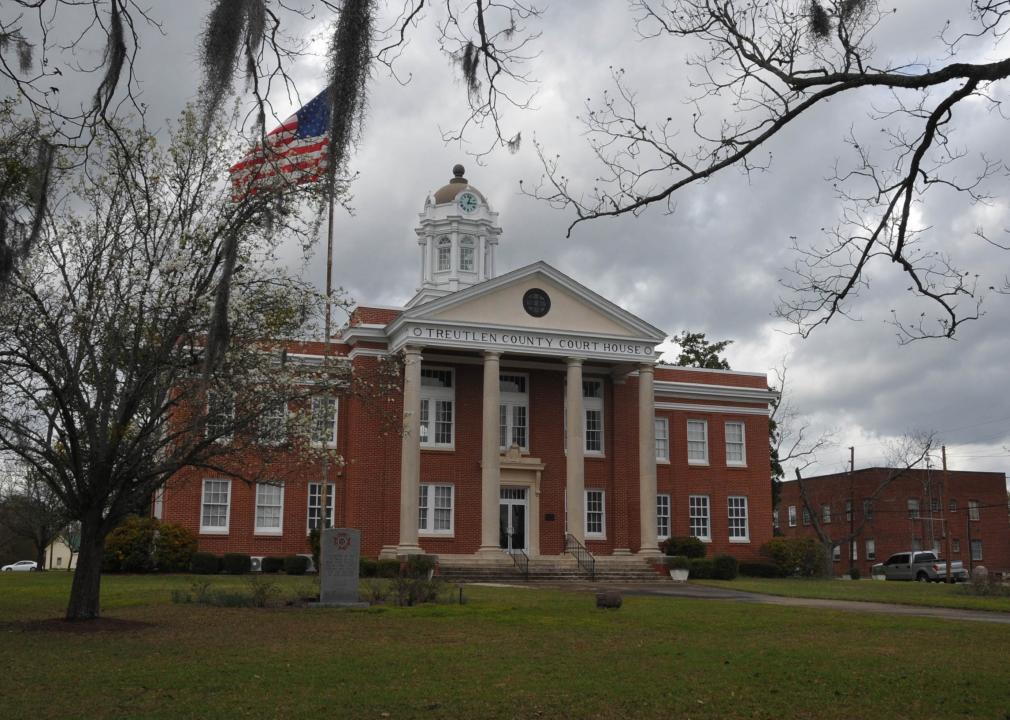
JERRYE & ROY KLOTZ MD // Wikimedia Commons
#19. Treutlen County
– Child food insecurity rate: 25.5% (410 total)
— 9.4% higher than national average
– Food insecurity rate: 19.7% (1,340 total)
— 7.9% higher than national average
– Annual food budget shortfall: $667,000
— Cost per meal: $3.09
Michael Rivera // Wikimedia Commons
#18. Turner County
– Child food insecurity rate: 25.7% (500 total)
— 9.6% higher than national average
– Food insecurity rate: 17.9% (1,420 total)
— 6.1% higher than national average
– Annual food budget shortfall: $674,000
— Cost per meal: $2.95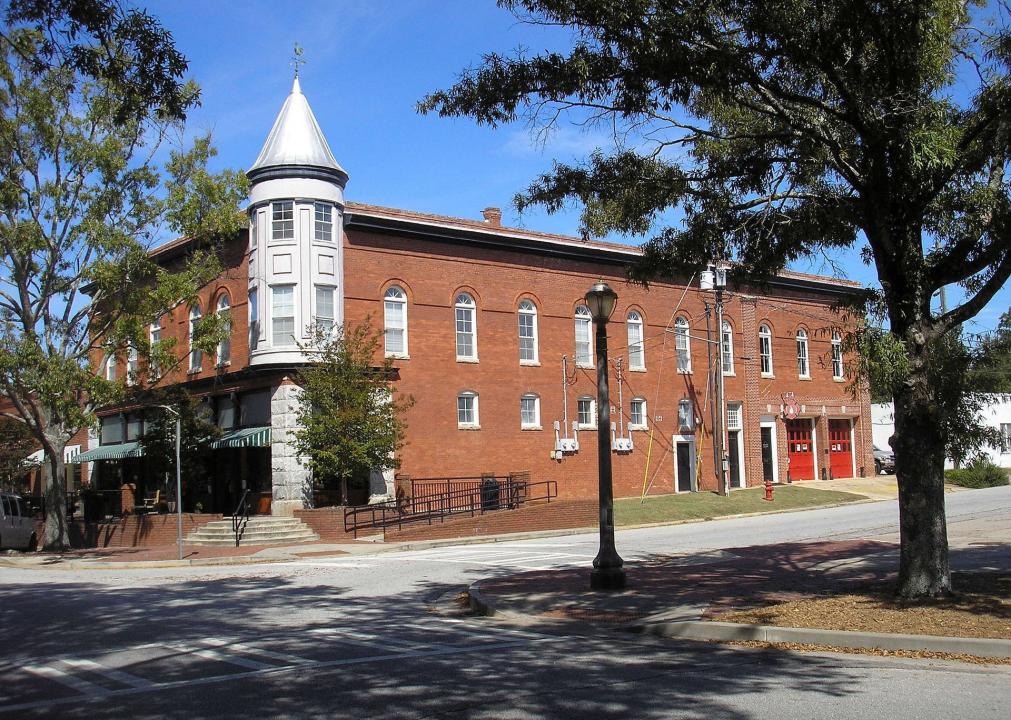
Blastoids // Wikimedia Commons
#17. Jefferson County
– Child food insecurity rate: 25.9% (950 total)
— 9.8% higher than national average
– Food insecurity rate: 13.6% (2,110 total)
— 1.8% higher than national average
– Annual food budget shortfall: $998,000
— Cost per meal: $2.94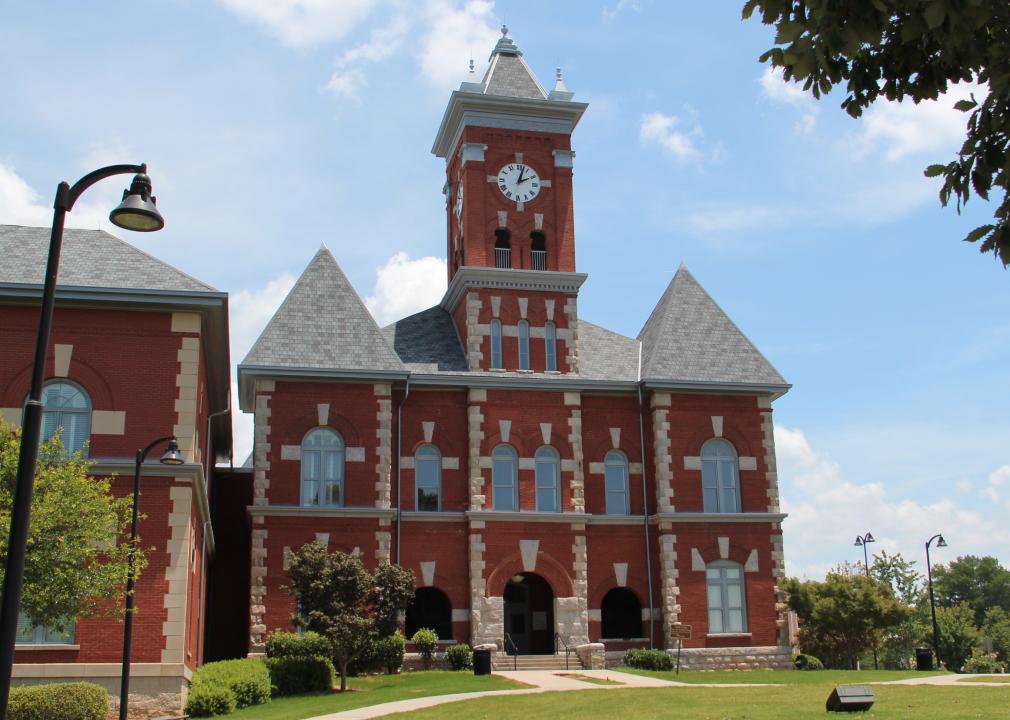
Thomson200 // Wikimedia Commons
#16. Clayton County
– Child food insecurity rate: 26.1% (20,930 total)
— 10.0% higher than national average
– Food insecurity rate: 12.4% (35,650 total)
— 0.6% higher than national average
– Annual food budget shortfall: $17,530,000
— Cost per meal: $3.05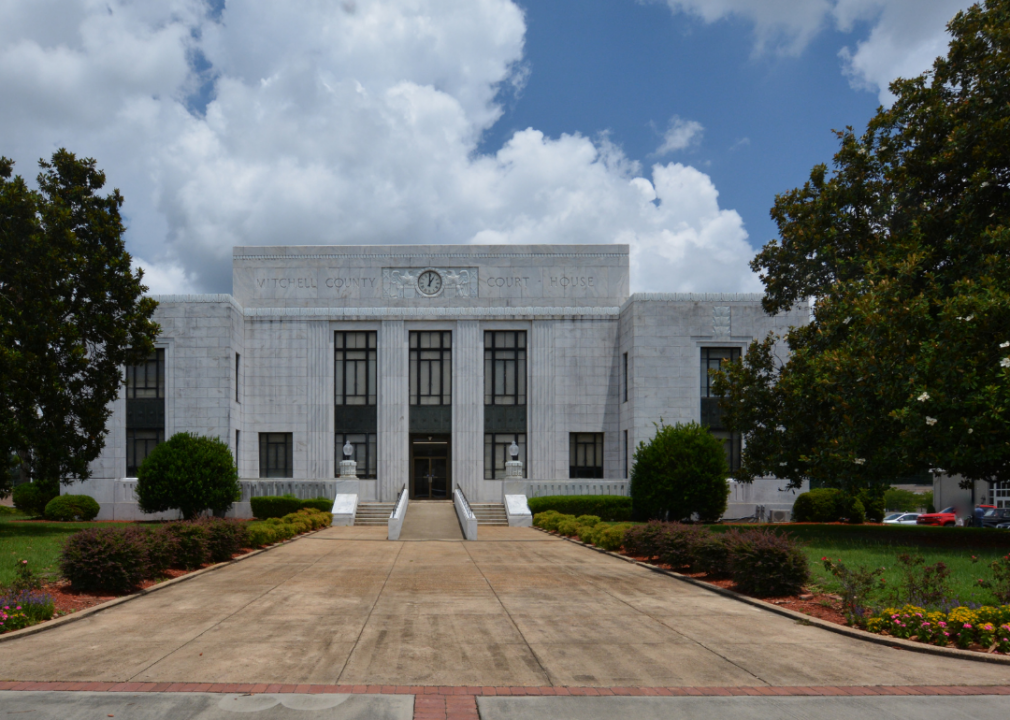
Canva
#15. Mitchell County
– Child food insecurity rate: 26.3% (1,280 total)
— 10.2% higher than national average
– Food insecurity rate: 16.0% (3,520 total)
— 4.2% higher than national average
– Annual food budget shortfall: $1,715,000
— Cost per meal: $3.03
Canva
#14. Bibb County
– Child food insecurity rate: 27.0% (10,050 total)
— 10.9% higher than national average
– Food insecurity rate: 16.1% (24,670 total)
— 4.3% higher than national average
– Annual food budget shortfall: $12,751,000
— Cost per meal: $3.21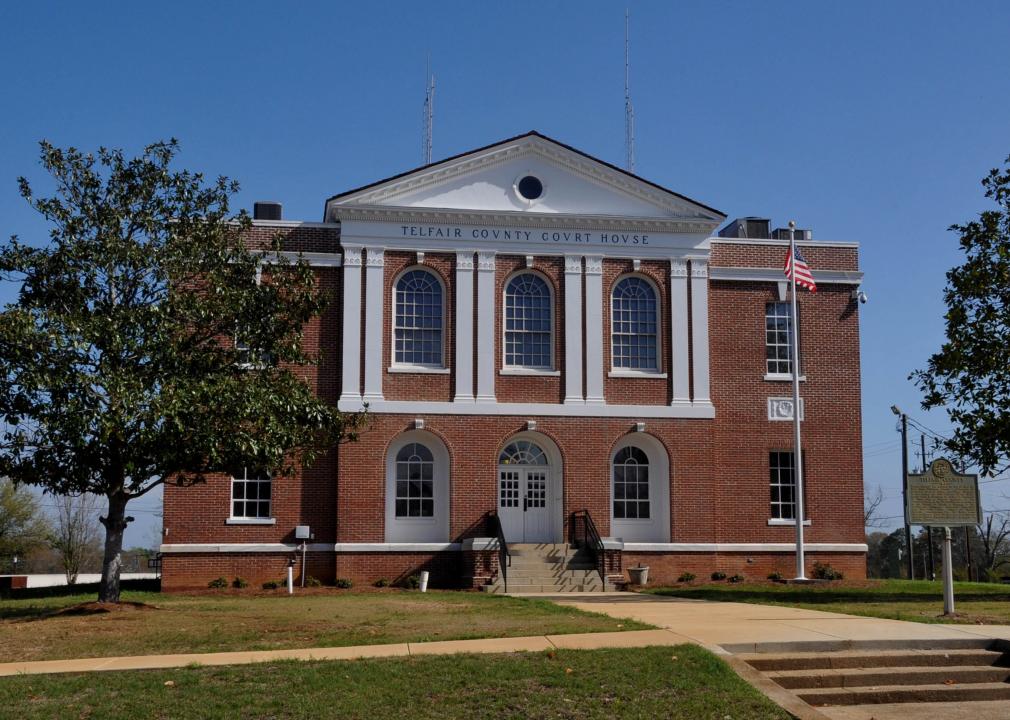
JERRYE & ROY KLOTZ MD // Wikimedia Commons
#13. Telfair County
– Child food insecurity rate: 27.6% (720 total)
— 11.5% higher than national average
– Food insecurity rate: 17.3% (2,750 total)
— 5.5% higher than national average
– Annual food budget shortfall: $1,349,000
— Cost per meal: $3.05
Michael Rivera // Wikimedia Commons
#12. Dooly County
– Child food insecurity rate: 28.1% (660 total)
— 12.0% higher than national average
– Food insecurity rate: 14.4% (1,960 total)
— 2.6% higher than national average
– Annual food budget shortfall: $976,000
— Cost per meal: $3.09
Rivers Langley; SaveRivers // Wikimedia Commons
#11. Randolph County
– Child food insecurity rate: 28.7% (520 total)
— 12.6% higher than national average
– Food insecurity rate: 16.7% (1,150 total)
— 4.9% higher than national average
– Annual food budget shortfall: $583,000
— Cost per meal: $3.15
Kevin Ruck // Shutterstock
#10. Richmond County
– Child food insecurity rate: 28.8% (13,300 total)
— 12.7% higher than national average
– Food insecurity rate: 15.7% (31,740 total)
— 3.9% higher than national average
– Annual food budget shortfall: $16,191,000
— Cost per meal: $3.17
Robbie Honerkamp // Wikimedia Commons
#9. Stewart County
– Child food insecurity rate: 29.7% (220 total)
— 13.6% higher than national average
– Food insecurity rate: 15.5% (1,000 total)
— 3.7% higher than national average
– Annual food budget shortfall: $548,000
— Cost per meal: $3.40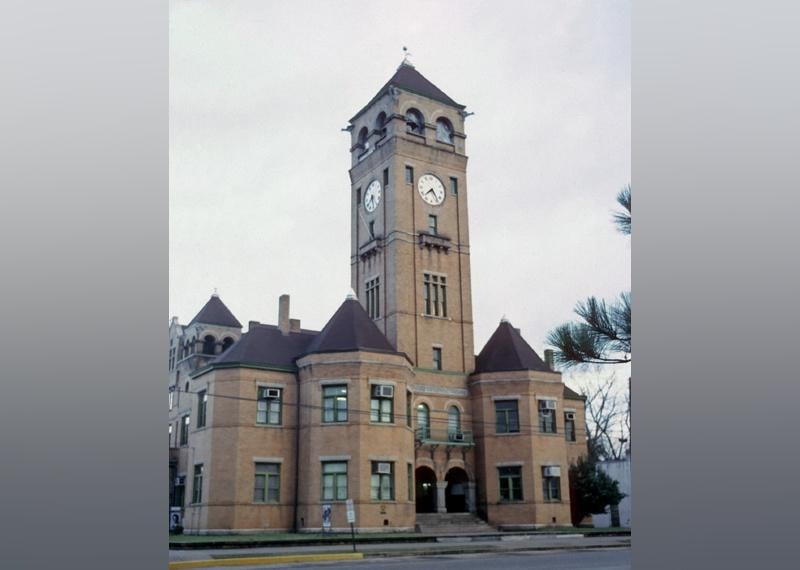
Mbclark2 // Wikimedia Commons
#8. Macon County
– Child food insecurity rate: 30.5% (760 total)
— 14.4% higher than national average
– Food insecurity rate: 15.9% (2,080 total)
— 4.1% higher than national average
– Annual food budget shortfall: $1,534,000
— Cost per meal: $4.58
Robbie Honerkamp // Wikimedia Commons
#7. Early County
– Child food insecurity rate: 30.9% (780 total)
— 14.8% higher than national average
– Food insecurity rate: 16.7% (1,710 total)
— 4.9% higher than national average
– Annual food budget shortfall: $933,000
— Cost per meal: $3.39
Canva
#6. Warren County
– Child food insecurity rate: 31.0% (330 total)
— 14.9% higher than national average
– Food insecurity rate: 14.9% (780 total)
— 3.1% higher than national average
– Annual food budget shortfall: $366,000
— Cost per meal: $2.92
Michael Rivera // Wikimedia Commons
#5. Terrell County
– Child food insecurity rate: 31.4% (630 total)
— 15.3% higher than national average
– Food insecurity rate: 17.8% (1,540 total)
— 6.0% higher than national average
– Annual food budget shortfall: $877,000
— Cost per meal: $3.54
Ireana Medlin // Wikimedia Commons
#4. Dougherty County
– Child food insecurity rate: 31.5% (6,660 total)
— 15.4% higher than national average
– Food insecurity rate: 17.1% (15,160 total)
— 5.3% higher than national average
– Annual food budget shortfall: $7,824,000
— Cost per meal: $3.21
Michael Rivera // Wikimedia Commons
#3. Crisp County
– Child food insecurity rate: 32.1% (1,730 total)
— 16.0% higher than national average
– Food insecurity rate: 19.1% (4,310 total)
— 7.3% higher than national average
– Annual food budget shortfall: $2,146,000
— Cost per meal: $3.09
csmith/dbb1 // Wikimedia Commons
#2. Hancock County
– Child food insecurity rate: 33.9% (310 total)
— 17.8% higher than national average
– Food insecurity rate: 14.6% (1,240 total)
— 2.8% higher than national average
– Annual food budget shortfall: $642,000
— Cost per meal: $3.21
Robbie Honerkamp // Wikimedia Commons
#1. Clay County
– Child food insecurity rate: 41.3% (240 total)
— 25.2% higher than national average
– Food insecurity rate: 20.5% (600 total)
— 8.7% higher than national average
– Annual food budget shortfall: $304,000
— Cost per meal: $3.15
Get More Context: With the barrage of information coming through your social media feeds and phone notifications, it can be hard to get a clear picture of what’s happening in your community and throughout the state. Click here to see what else is happening in The Peach State and get your news in context instead of relying on social media feeds and notifications for your news. We’ll help you stay informed.