
Rain, sleet, snow, hail, wintry mix. Precipitation takes on many forms, and the degree to which climate change affects precipitation levels comes down to something almost everyone learns about in school—Earth’s water cycle. A system in endless motion, the water cycle traces the process through which water exists in its three primary phases—liquid, solid, and gas—as it moves perpetually between the Earth and its atmosphere.
Increases in precipitation frequency and intensity are markers of climate change. When temperatures rise and oceans grow warmer, the amount of water that evaporates into the atmosphere—and the speed at which it does so—also increases. As atmospheric circulation carries the moisture-rich air over land or pushes it into a storm system, heavy rain or snow is often the result.
The continental U.S. on average received about 30 inches of precipitation between March 2022 and February 2023. Traditionally “wet” regions—such as Washington state and Alaska in the northwest and Georgia and Mississippi in the southeast—continue to have some of the rainiest counties in the United States. Other areas such as Oklahoma, Kansas, and Nebraska, as well as pockets of the South and of California, experience the opposite extreme: drought, also largely a product of climate change.
Stacker cited data from the National Centers for Environmental Information to identify the counties in Georgia that receive the most precipitation through rain, sleet, or snow. Counties are ranked by five-year precipitation averages in inches as of February 2023 with rainfall over the past year serving as a tiebreaker. Supplementary data on how last year’s precipitation compares to the 100-year average for the area is also included.
Canva
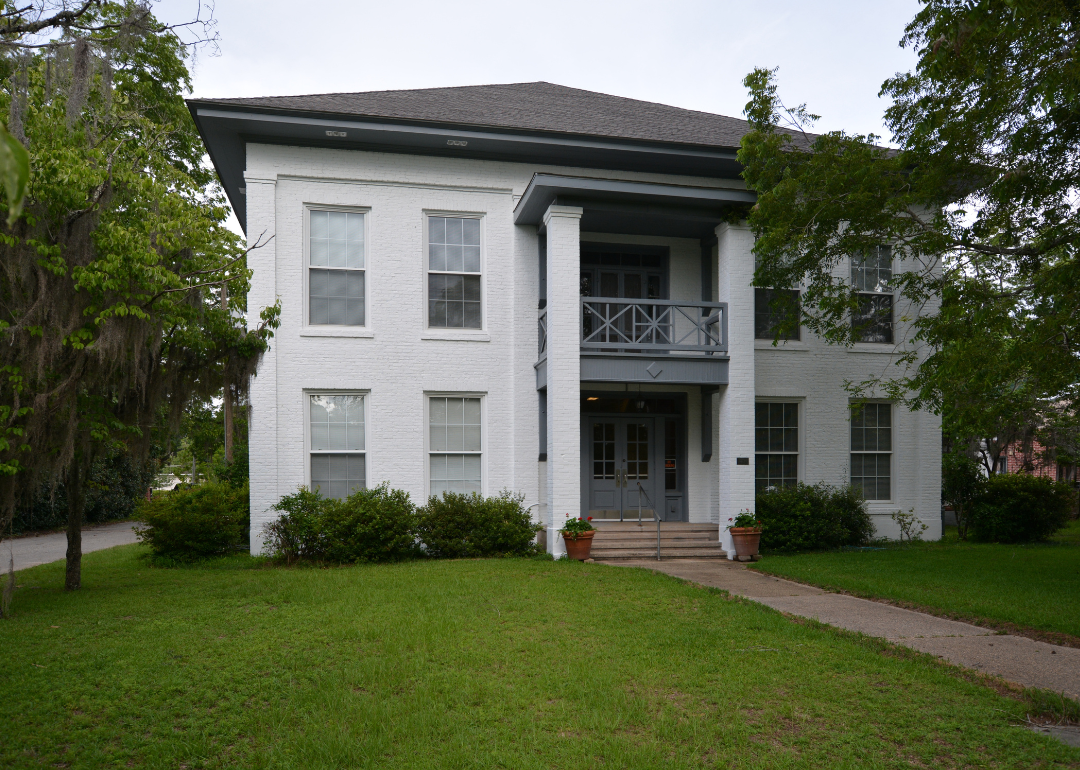
#50. Clay County
– Five-year precipitation average: 56.52 inches
– Precipitation over the past year: 51.26 inches (#59 rainiest year since 1895)
– Precipitation compared to 1901-2000 average: -1.02 inches below norm
Sean Pavone // Shutterstock
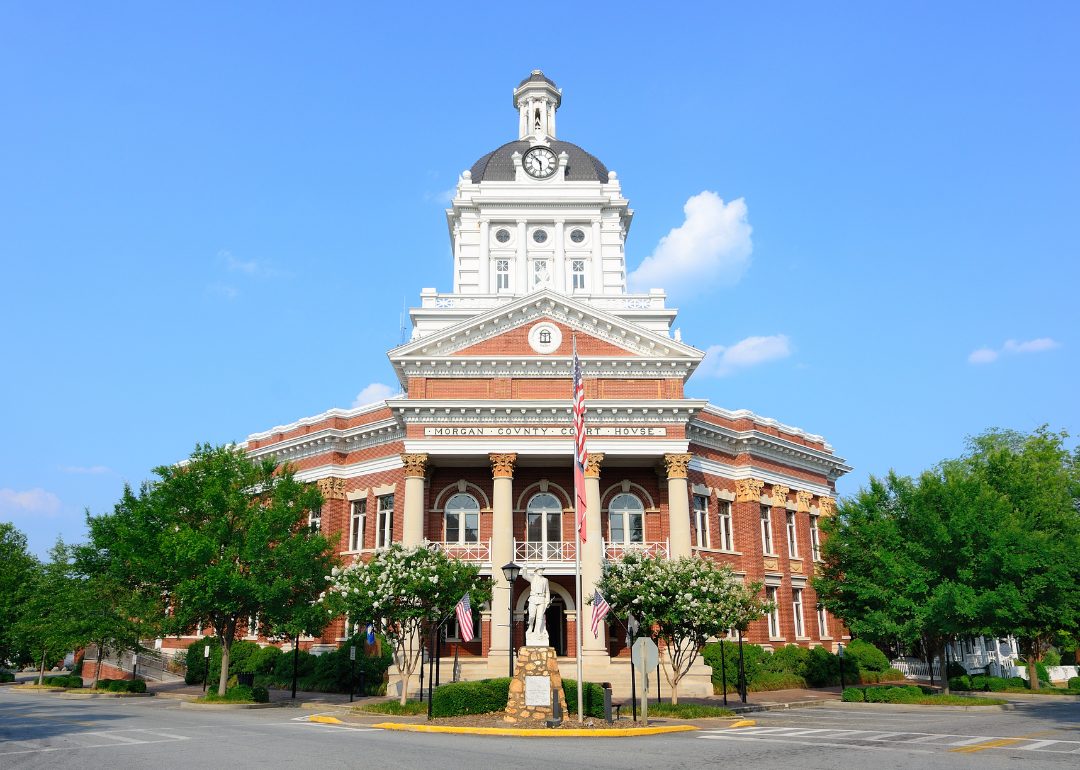
#49. Madison County
– Five-year precipitation average: 56.76 inches
– Precipitation over the past year: 48.38 inches (#59 rainiest year since 1895)
– Precipitation compared to 1901-2000 average: -1.32 inches below norm

Canva
#48. Pike County
– Five-year precipitation average: 56.82 inches
– Precipitation over the past year: 49.32 inches (#62 rainiest year since 1895)
– Precipitation compared to 1901-2000 average: -0.97 inches below norm
Canva
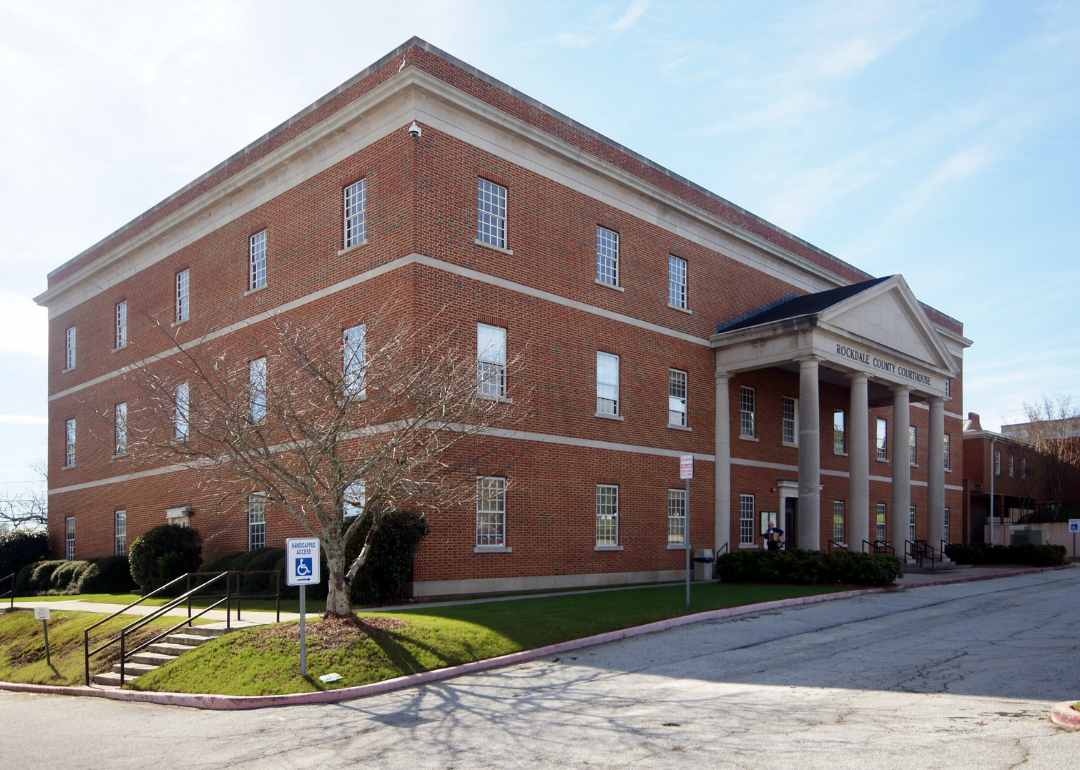
#47. Rockdale County
– Five-year precipitation average: 56.91 inches
– Precipitation over the past year: 52.25 inches (#77 rainiest year since 1895)
– Precipitation compared to 1901-2000 average: 1.82 inches above norm
Canva
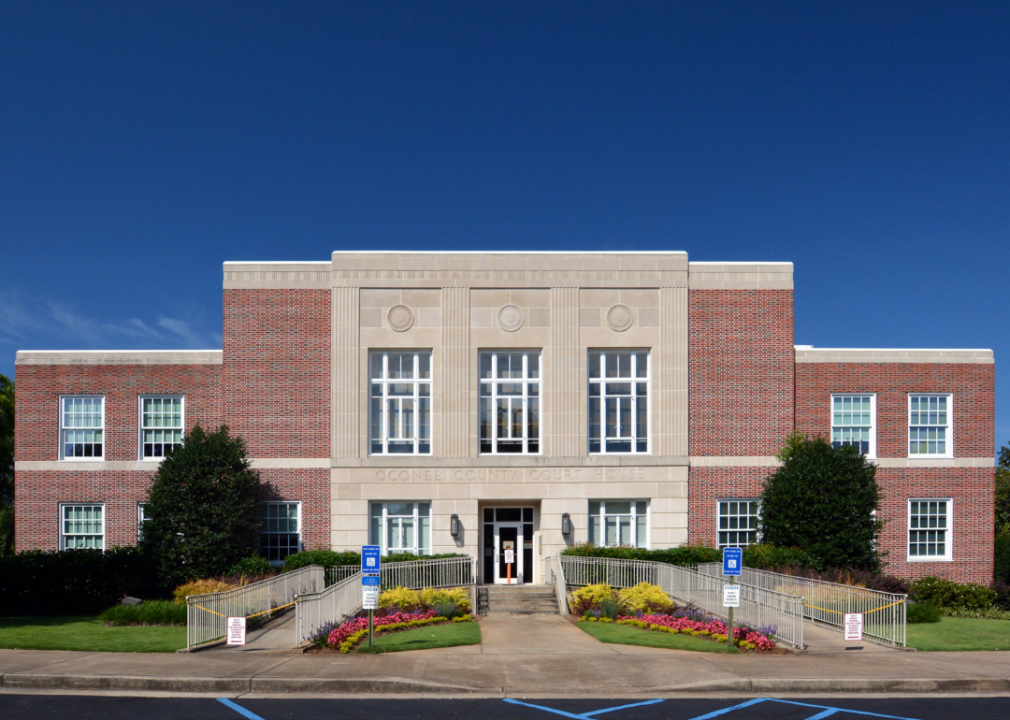
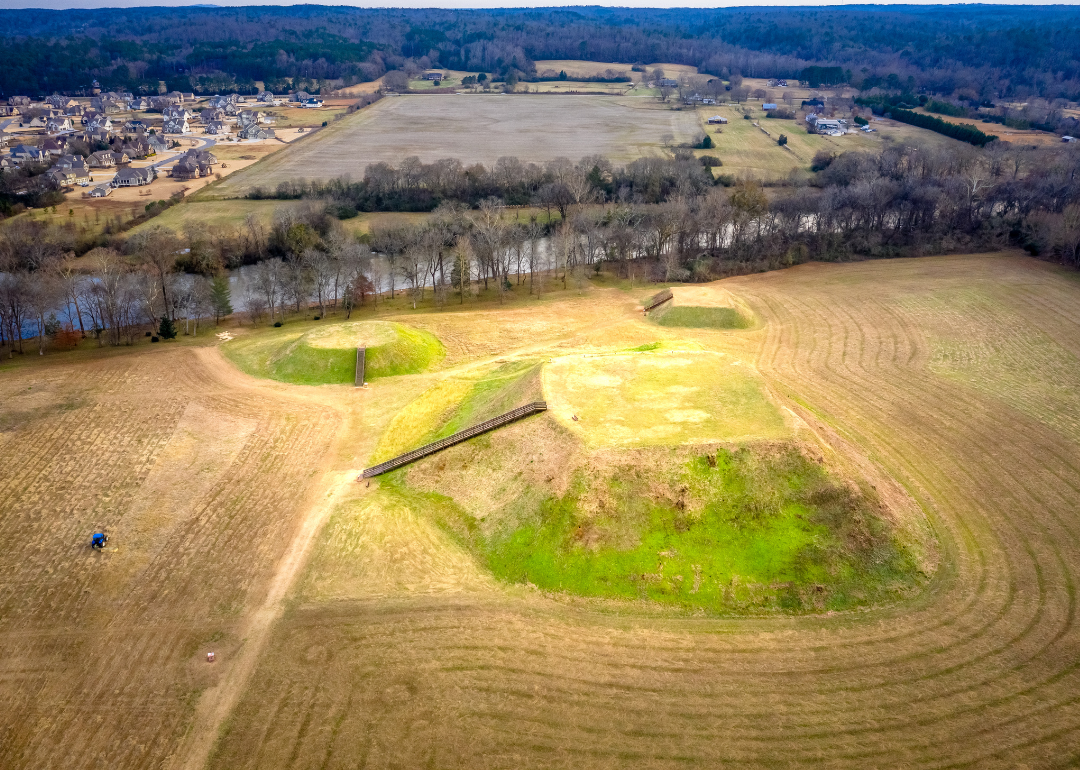
#46. Oconee County
– Five-year precipitation average: 56.92 inches
– Precipitation over the past year: 51.09 inches (#73 rainiest year since 1895)
– Precipitation compared to 1901-2000 average: 1.21 inches above norm
Canva
#45. Bartow County
– Five-year precipitation average: 56.92 inches
– Precipitation over the past year: 51.13 inches (#69 rainiest year since 1895)
– Precipitation compared to 1901-2000 average: -0.14 inches below norm

Canva
#44. Walton County
– Five-year precipitation average: 57.06 inches
– Precipitation over the past year: 51.48 inches (#71 rainiest year since 1895)
– Precipitation compared to 1901-2000 average: 0.92 inches above norm

Canva
#43. Muscogee County
– Five-year precipitation average: 57.08 inches
– Precipitation over the past year: 48.68 inches (#64 rainiest year since 1895)
– Precipitation compared to 1901-2000 average: -0.94 inches below norm

Canva
#42. Clarke County
– Five-year precipitation average: 57.21 inches
– Precipitation over the past year: 50.67 inches (#71 rainiest year since 1895)
– Precipitation compared to 1901-2000 average: 0.72 inches above norm

Canva
#41. Paulding County
– Five-year precipitation average: 57.24 inches
– Precipitation over the past year: 52.98 inches (#75 rainiest year since 1895)
– Precipitation compared to 1901-2000 average: 1.50 inches above norm

Canva
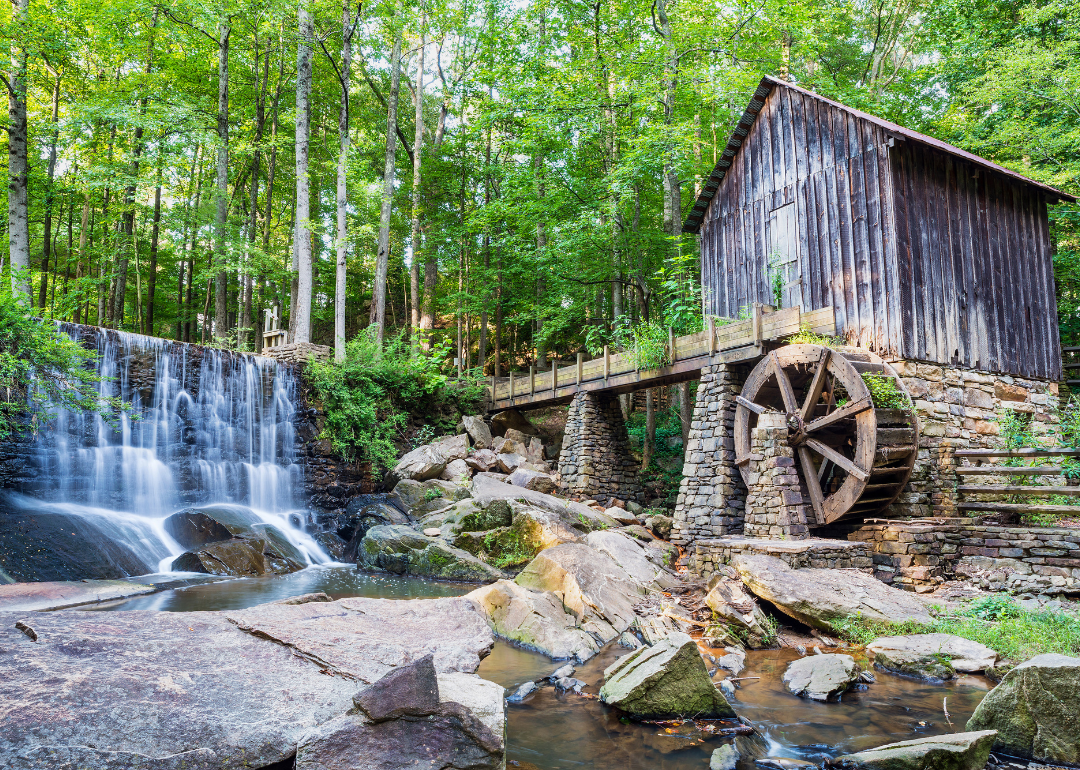
#40. Fayette County
– Five-year precipitation average: 57.59 inches
– Precipitation over the past year: 52.72 inches (#83 rainiest year since 1895)
– Precipitation compared to 1901-2000 average: 2.58 inches above norm
Canva
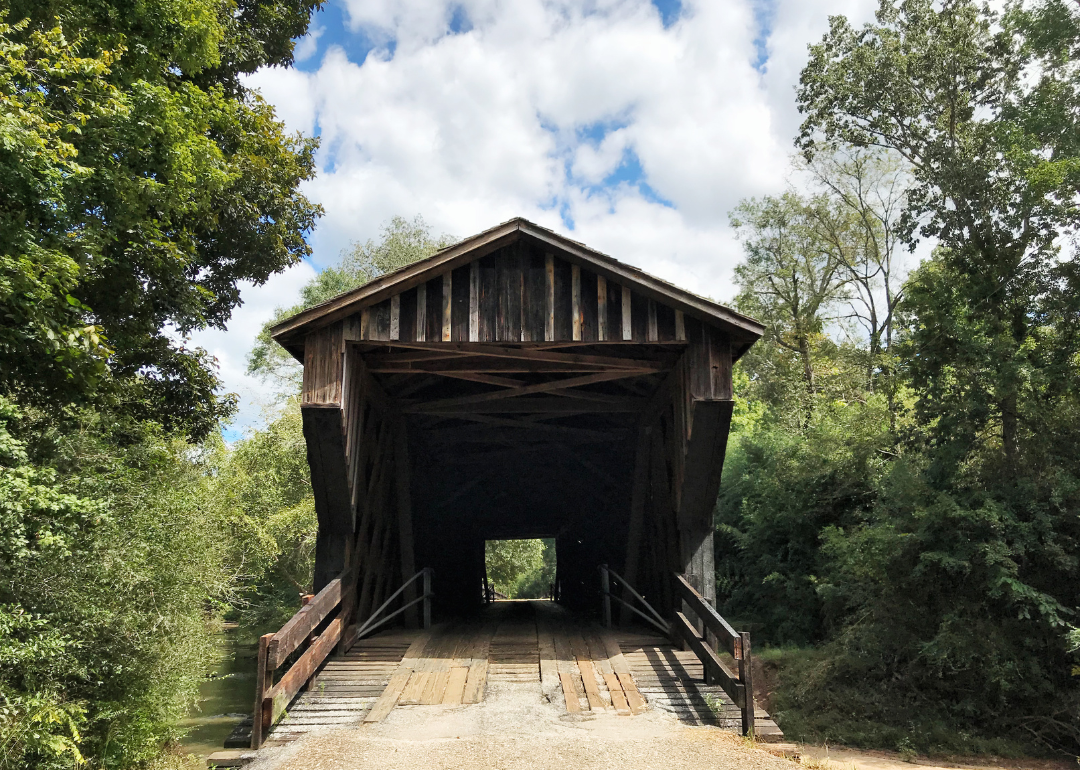
#39. Cobb County
– Five-year precipitation average: 58.18 inches
– Precipitation over the past year: 52.97 inches (#76 rainiest year since 1895)
– Precipitation compared to 1901-2000 average: 1.76 inches above norm
Canva
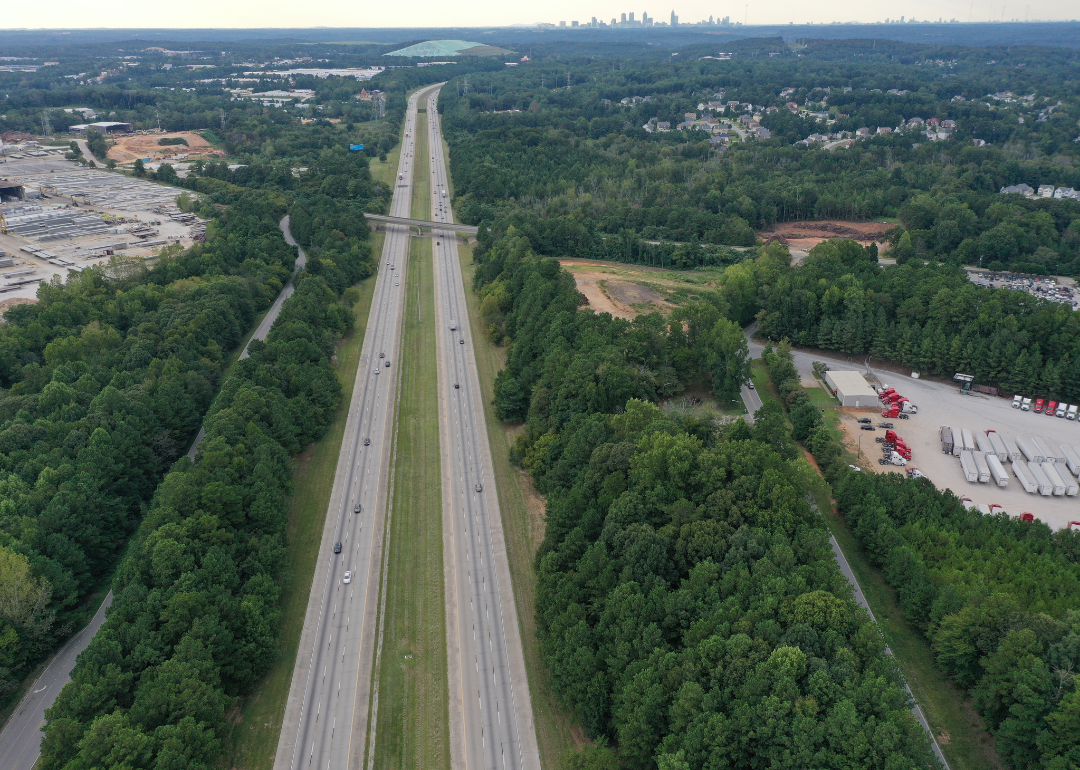
#38. Meriwether County
– Five-year precipitation average: 58.41 inches
– Precipitation over the past year: 49.69 inches (#59 rainiest year since 1895)
– Precipitation compared to 1901-2000 average: -1.47 inches below norm
Josemejia // Shutterstock
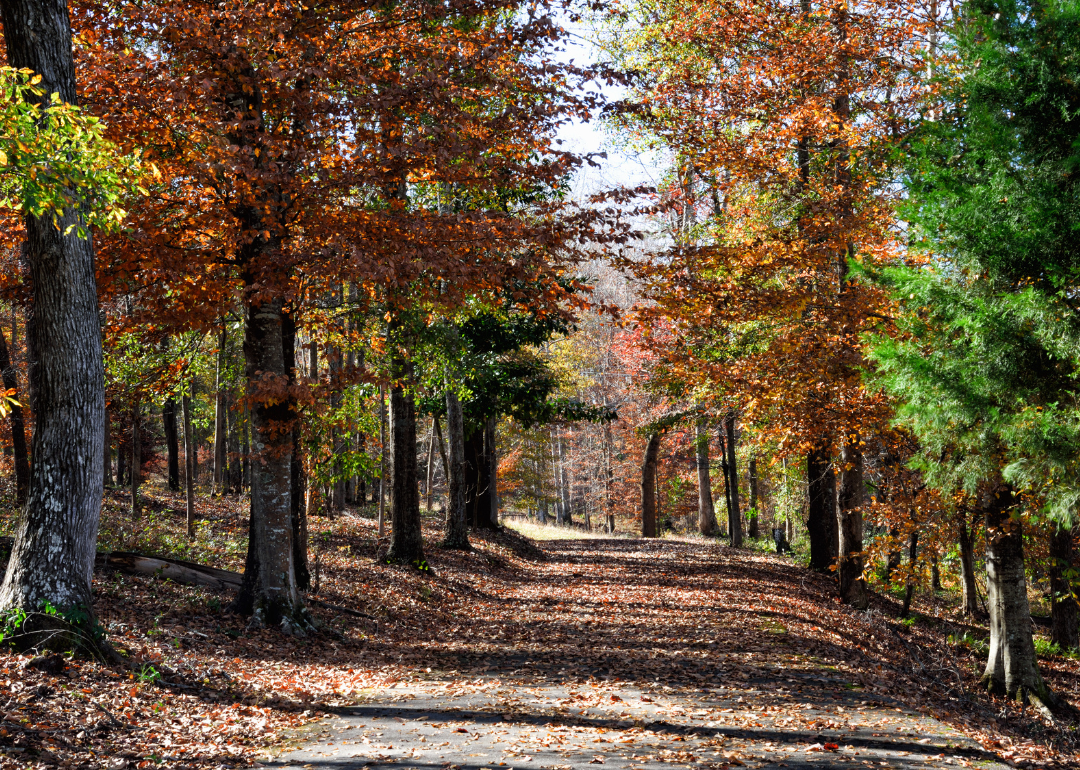
#37. Clayton County
– Five-year precipitation average: 58.47 inches
– Precipitation over the past year: 53.45 inches (#88 rainiest year since 1895)
– Precipitation compared to 1901-2000 average: 3.33 inches above norm
Canva
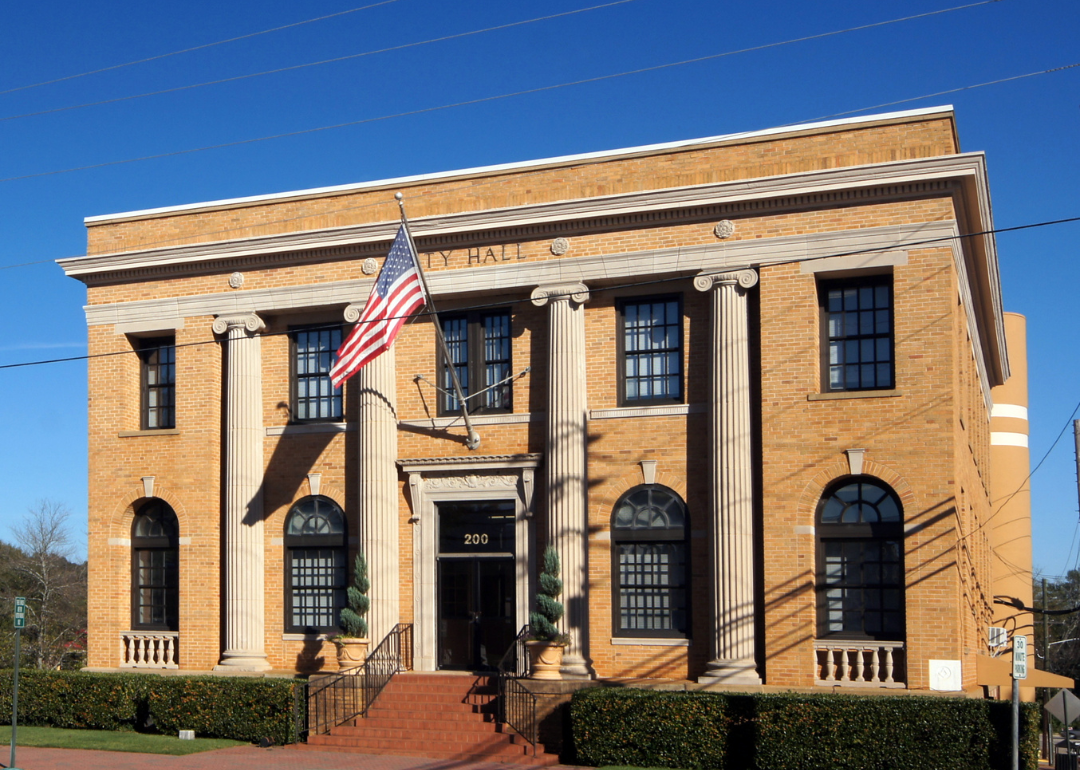
#36. Harris County
– Five-year precipitation average: 58.56 inches
– Precipitation over the past year: 49.62 inches (#56 rainiest year since 1895)
– Precipitation compared to 1901-2000 average: -1.76 inches below norm
Canva
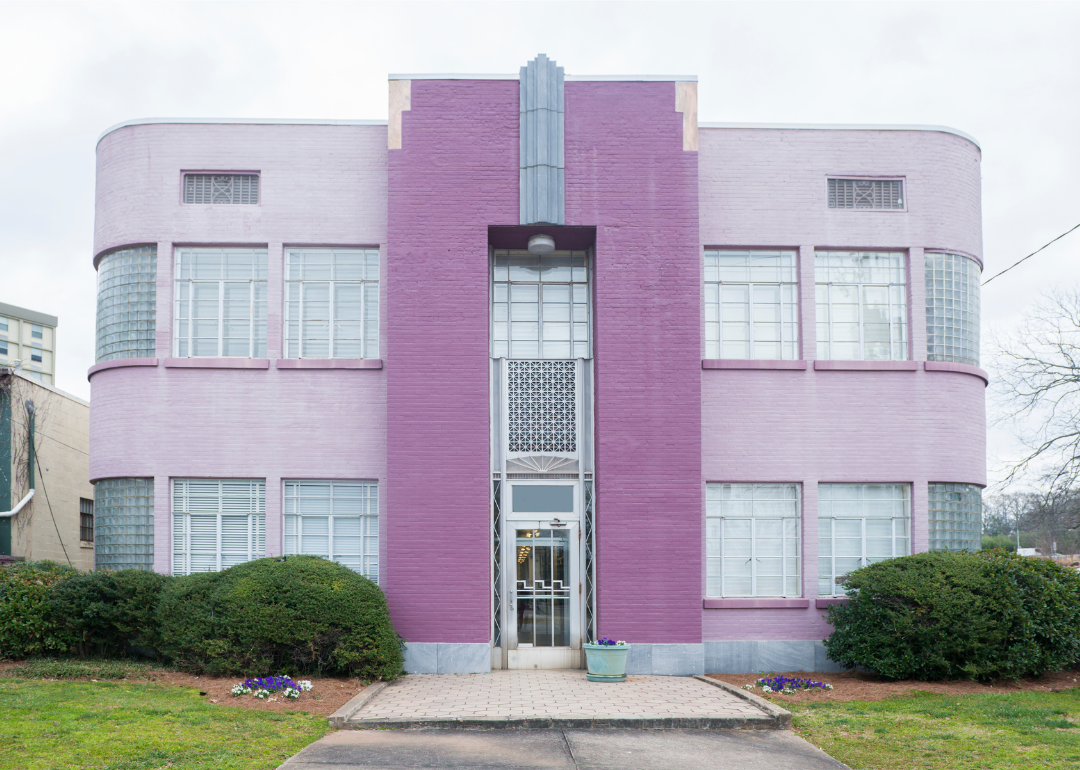
#35. Troup County
– Five-year precipitation average: 58.68 inches
– Precipitation over the past year: 51.64 inches (#63 rainiest year since 1895)
– Precipitation compared to 1901-2000 average: -0.18 inches below norm
Canva
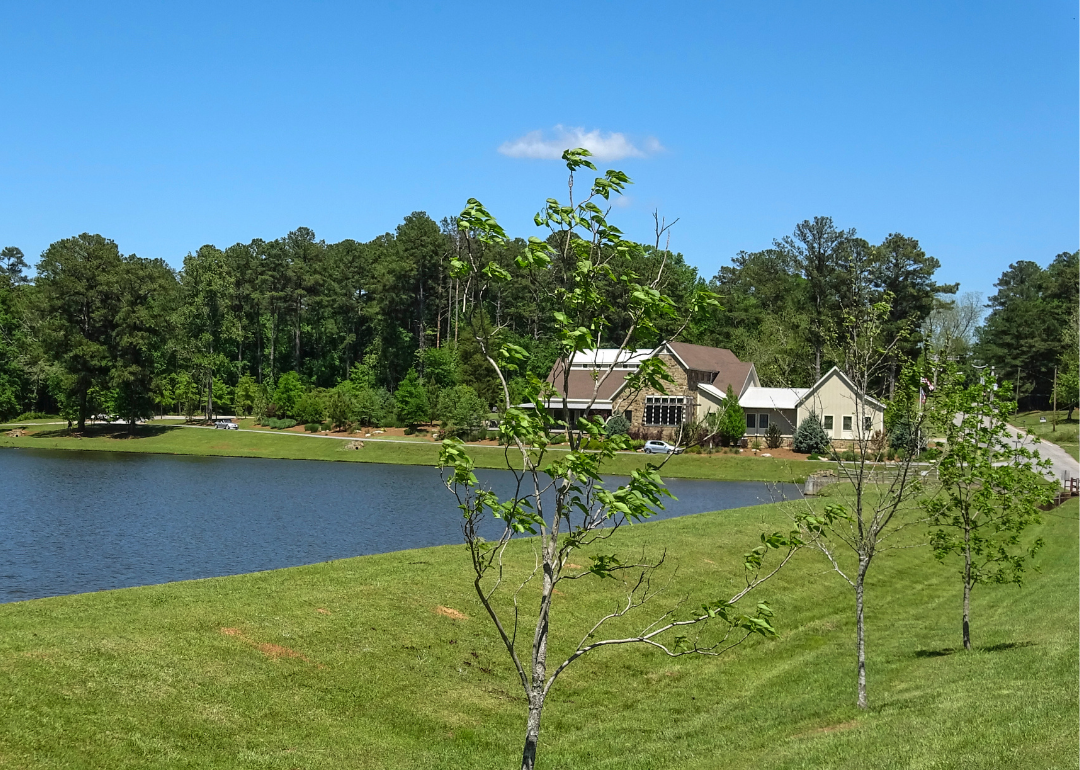
#34. DeKalb County
– Five-year precipitation average: 59.48 inches
– Precipitation over the past year: 54.13 inches (#85 rainiest year since 1895)
– Precipitation compared to 1901-2000 average: 3.57 inches above norm
Canva
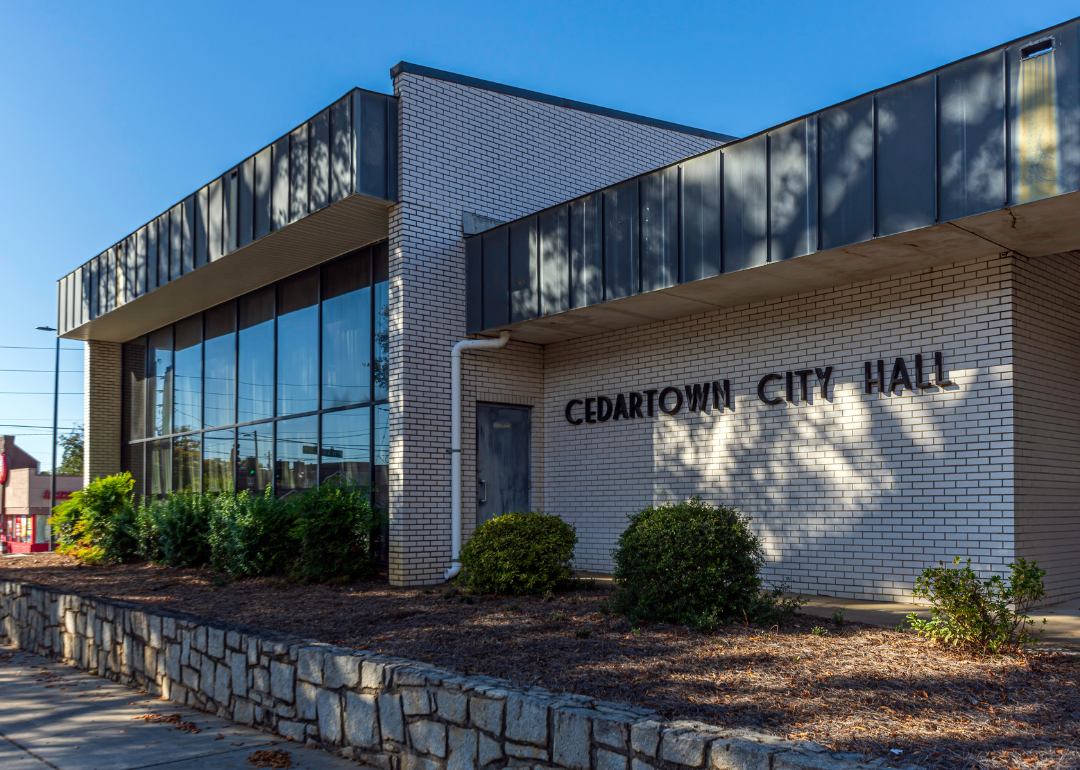
#33. Coweta County
– Five-year precipitation average: 59.54 inches
– Precipitation over the past year: 55.34 inches (#89 rainiest year since 1895)
– Precipitation compared to 1901-2000 average: 4.01 inches above norm
JNix // Shutterstock
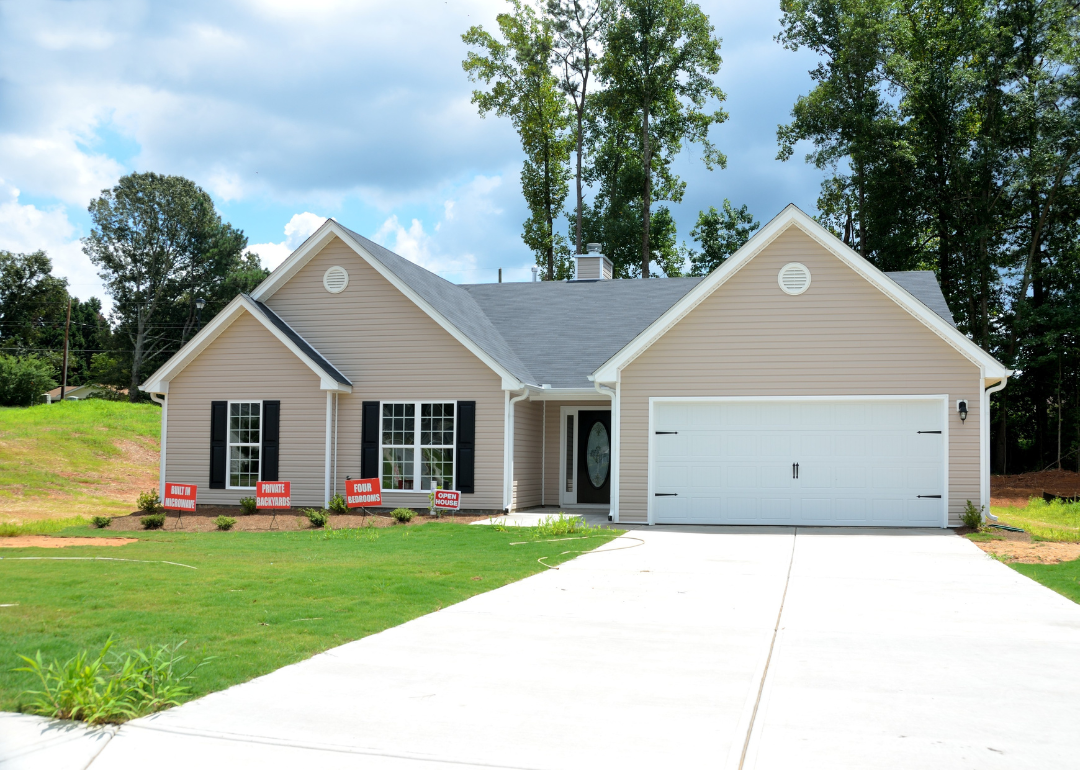
#32. Polk County
– Five-year precipitation average: 59.61 inches
– Precipitation over the past year: 56.23 inches (#93 rainiest year since 1895)
– Precipitation compared to 1901-2000 average: 5.02 inches above norm

Darryl Brooks // Shutterstock
#31. Cherokee County
– Five-year precipitation average: 59.73 inches
– Precipitation over the past year: 52.56 inches (#57 rainiest year since 1895)
– Precipitation compared to 1901-2000 average: -1.03 inches below norm
Paul Brennan // Shutterstock
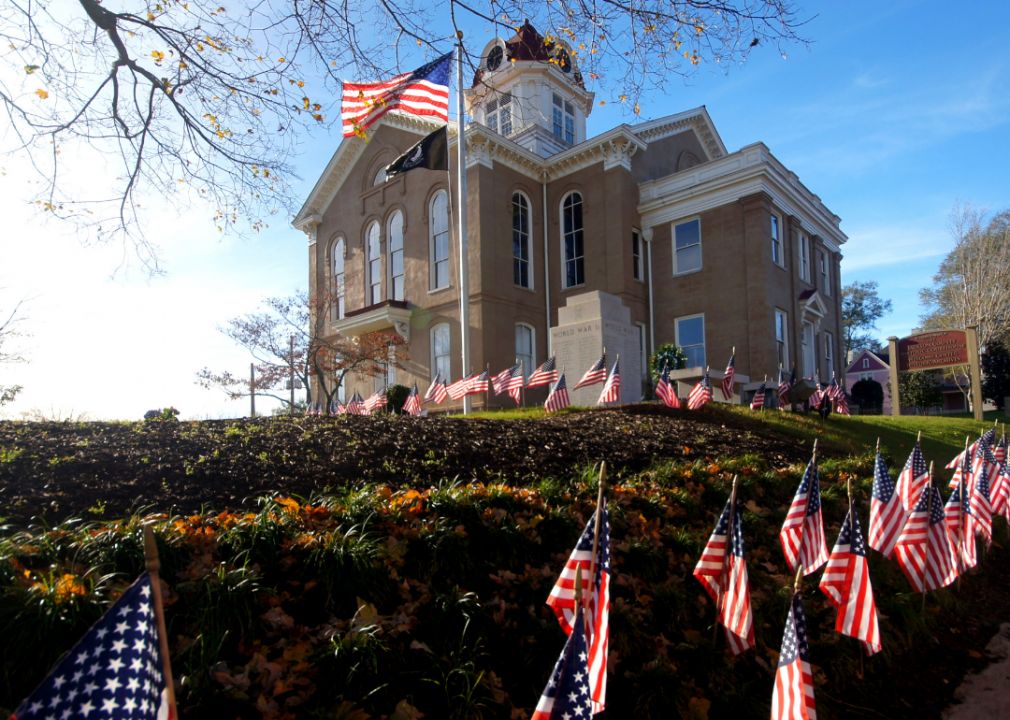
#30. Barrow County
– Five-year precipitation average: 59.76 inches
– Precipitation over the past year: 52.69 inches (#74 rainiest year since 1895)
– Precipitation compared to 1901-2000 average: 1.97 inches above norm

Brett Barnhill // Shutterstock
#29. Fulton County
– Five-year precipitation average: 59.95 inches
– Precipitation over the past year: 54.84 inches (#85 rainiest year since 1895)
– Precipitation compared to 1901-2000 average: 3.85 inches above norm
Canva
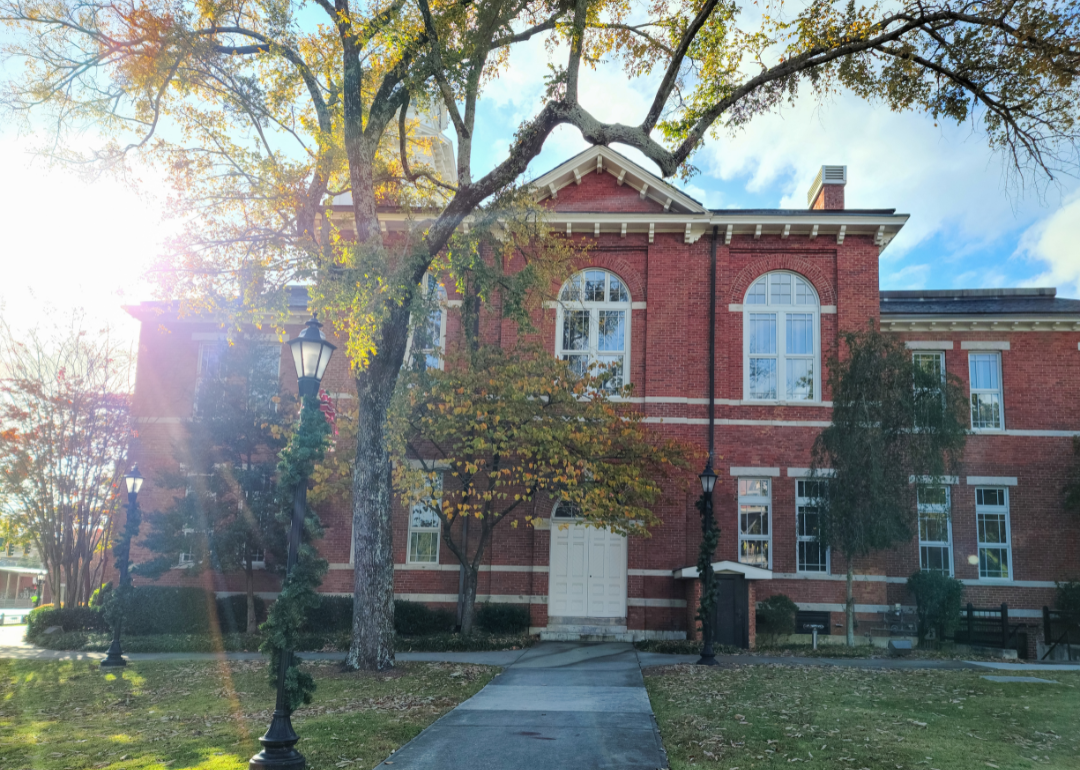
#28. Jackson County
– Five-year precipitation average: 60.07 inches
– Precipitation over the past year: 52.69 inches (#78 rainiest year since 1895)
– Precipitation compared to 1901-2000 average: 2.09 inches above norm
Canva
#27. Gwinnett County
– Five-year precipitation average: 60.81 inches
– Precipitation over the past year: 55.50 inches (#89 rainiest year since 1895)
– Precipitation compared to 1901-2000 average: 4.17 inches above norm
Canva
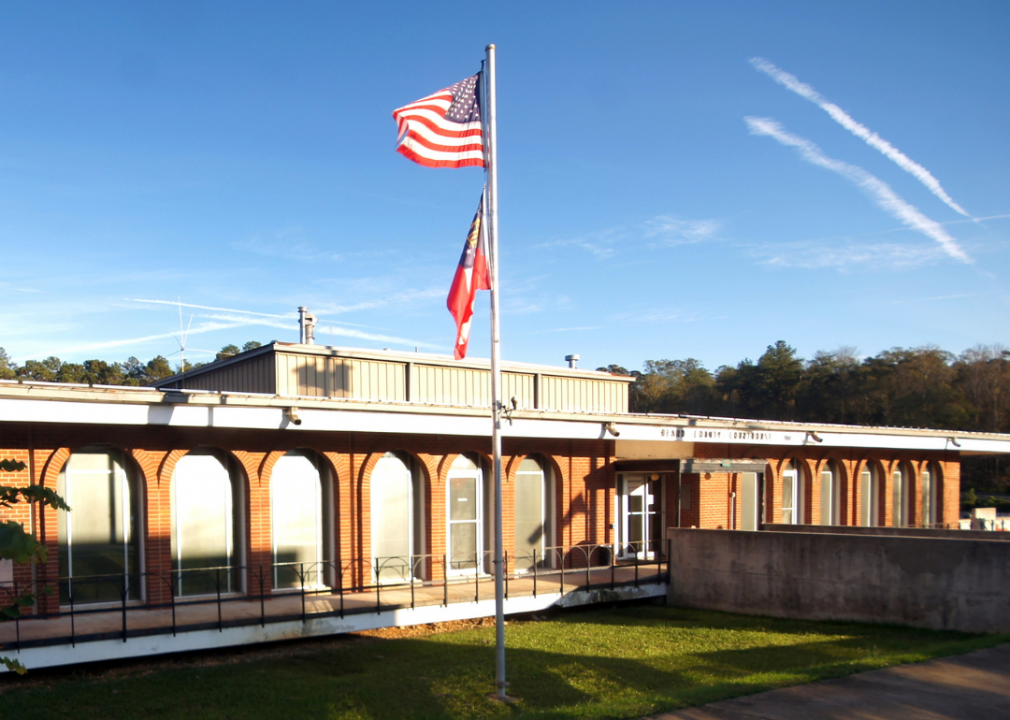
#26. Heard County
– Five-year precipitation average: 60.94 inches
– Precipitation over the past year: 57.42 inches (#88 rainiest year since 1895)
– Precipitation compared to 1901-2000 average: 4.40 inches above norm
chase s wingo // Shutterstock
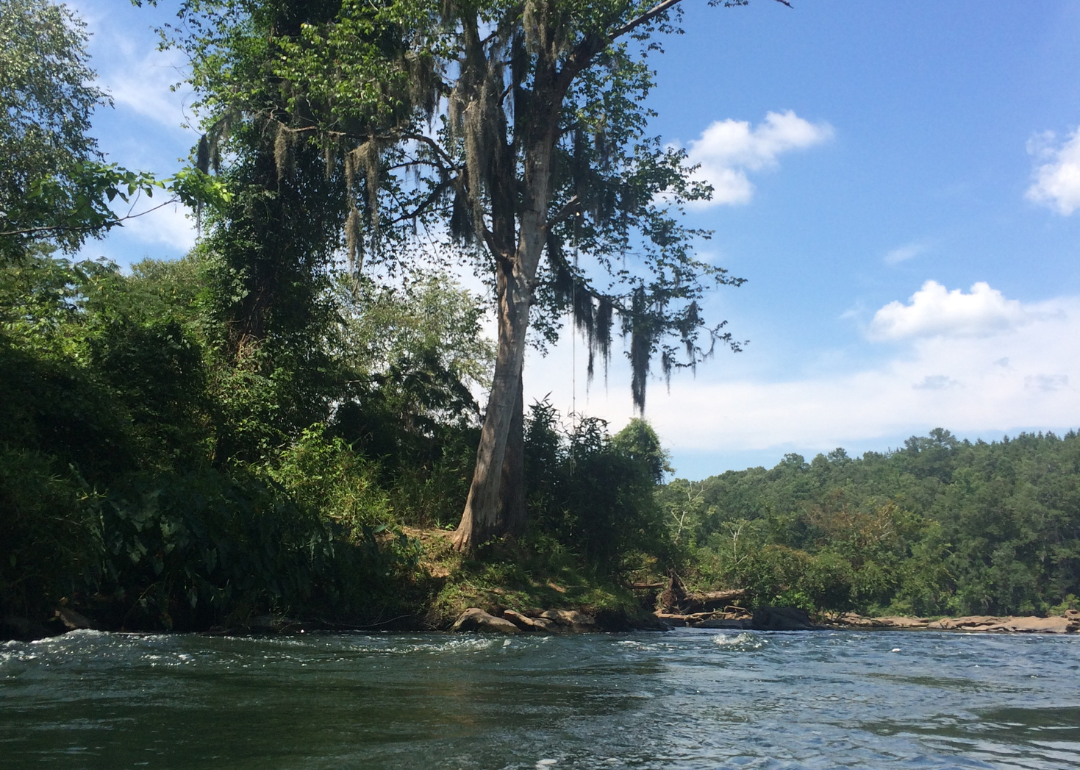
#25. Walker County
– Five-year precipitation average: 61.10 inches
– Precipitation over the past year: 54.12 inches (#72 rainiest year since 1895)
– Precipitation compared to 1901-2000 average: 0.24 inches above norm
Marcus E Jones // Shutterstock
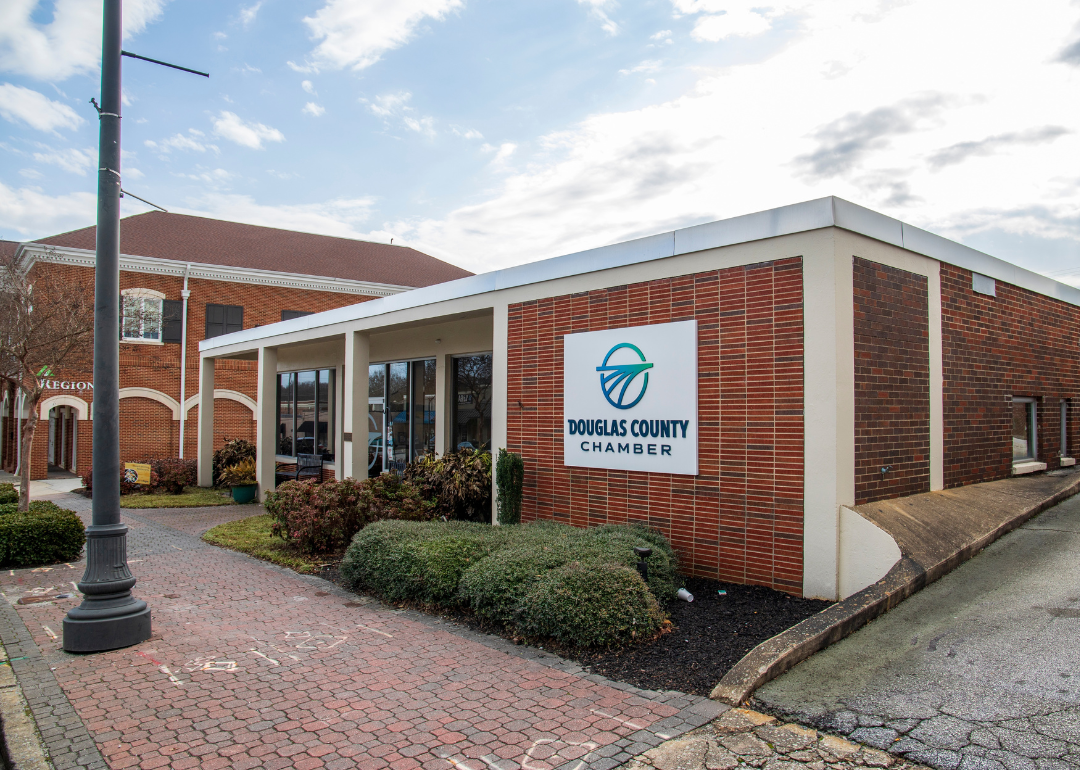
#24. Douglas County
– Five-year precipitation average: 61.12 inches
– Precipitation over the past year: 56.32 inches (#83 rainiest year since 1895)
– Precipitation compared to 1901-2000 average: 4.35 inches above norm

Canva
#23. Stephens County
– Five-year precipitation average: 61.71 inches
– Precipitation over the past year: 51.96 inches (#45 rainiest year since 1895)
– Precipitation compared to 1901-2000 average: -3.87 inches below norm

Canva
#22. Floyd County
– Five-year precipitation average: 61.81 inches
– Precipitation over the past year: 54.96 inches (#85 rainiest year since 1895)
– Precipitation compared to 1901-2000 average: 2.82 inches above norm
Canva
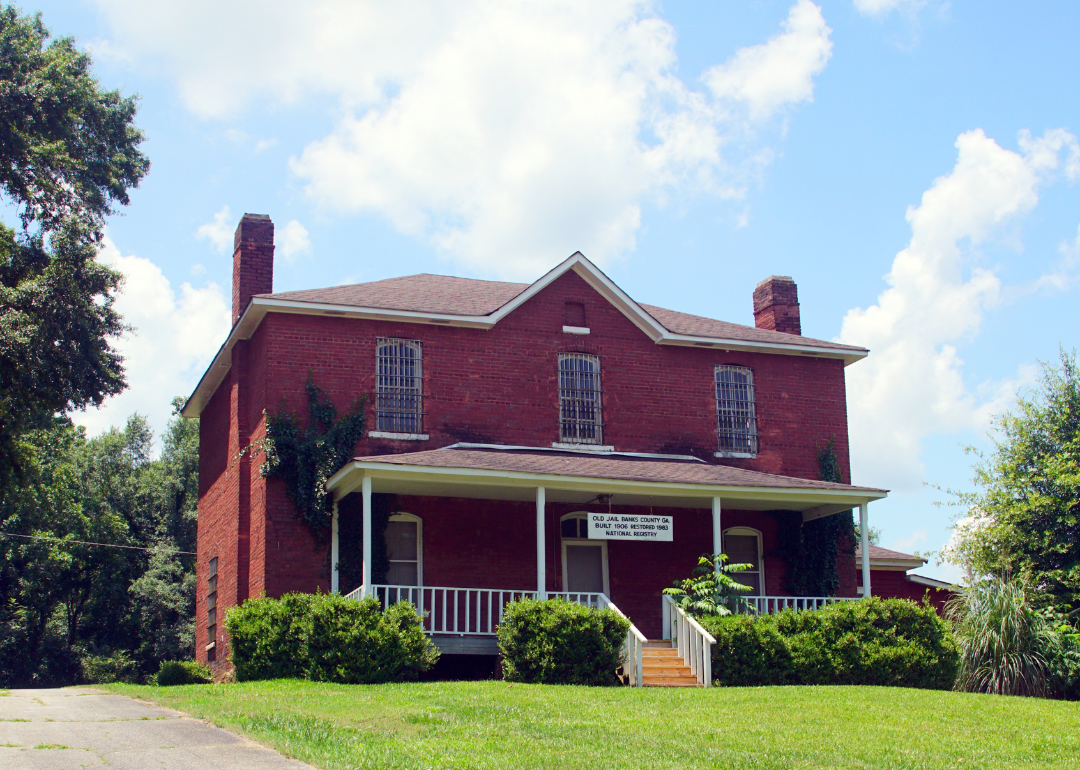
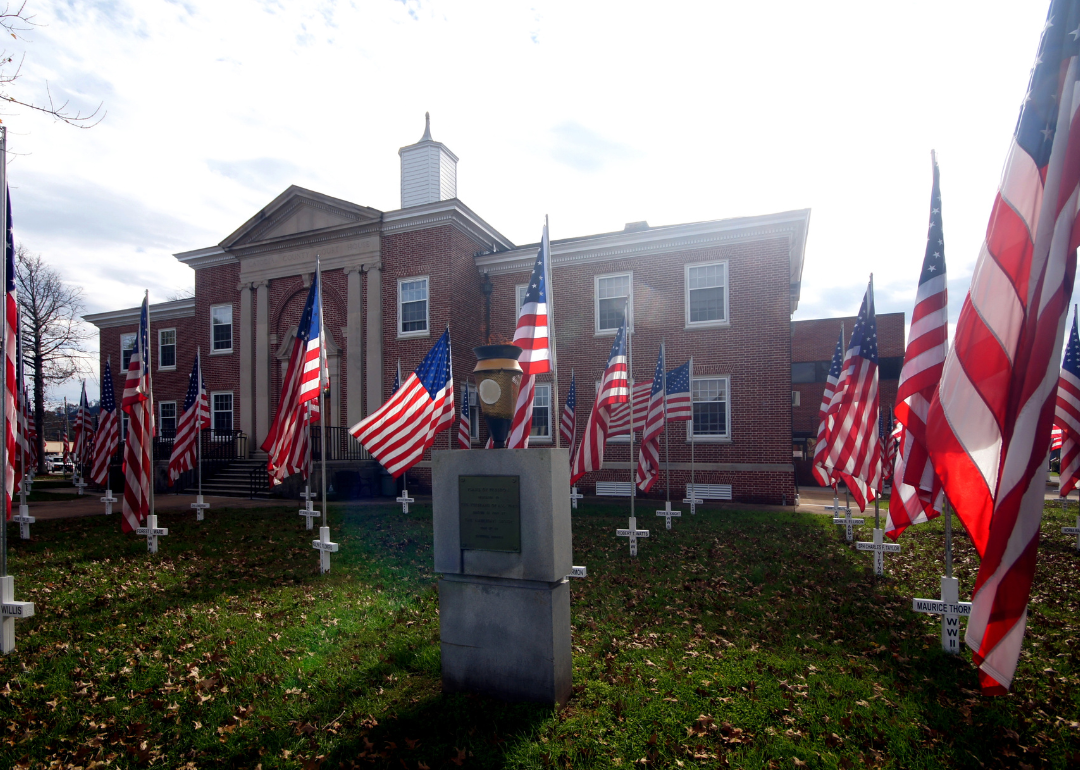
#21. Banks County
– Five-year precipitation average: 61.89 inches
– Precipitation over the past year: 53.14 inches (#66 rainiest year since 1895)
– Precipitation compared to 1901-2000 average: 0.19 inches above norm
Canva
#20. Catoosa County
– Five-year precipitation average: 61.98 inches
– Precipitation over the past year: 52.50 inches (#64 rainiest year since 1895)
– Precipitation compared to 1901-2000 average: -0.48 inches below norm

JNix // Shutterstock
#19. Gordon County
– Five-year precipitation average: 61.99 inches
– Precipitation over the past year: 52.03 inches (#59 rainiest year since 1895)
– Precipitation compared to 1901-2000 average: -0.81 inches below norm

Canva
#18. Forsyth County
– Five-year precipitation average: 63.37 inches
– Precipitation over the past year: 58.37 inches (#93 rainiest year since 1895)
– Precipitation compared to 1901-2000 average: 4.75 inches above norm
RodClementPhotography // Shutterstock
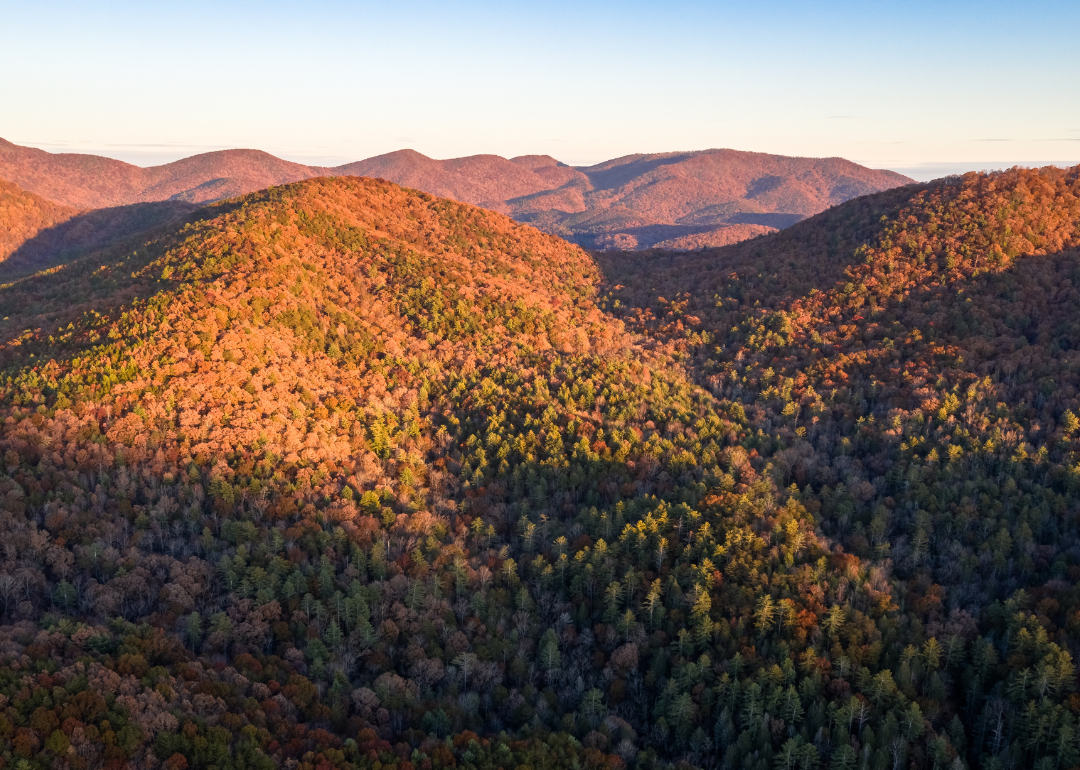
#17. Pickens County
– Five-year precipitation average: 63.70 inches
– Precipitation over the past year: 51.34 inches (#29 rainiest year since 1895)
– Precipitation compared to 1901-2000 average: -6.28 inches below norm
Harris Aerial Solutions // Shutterstock
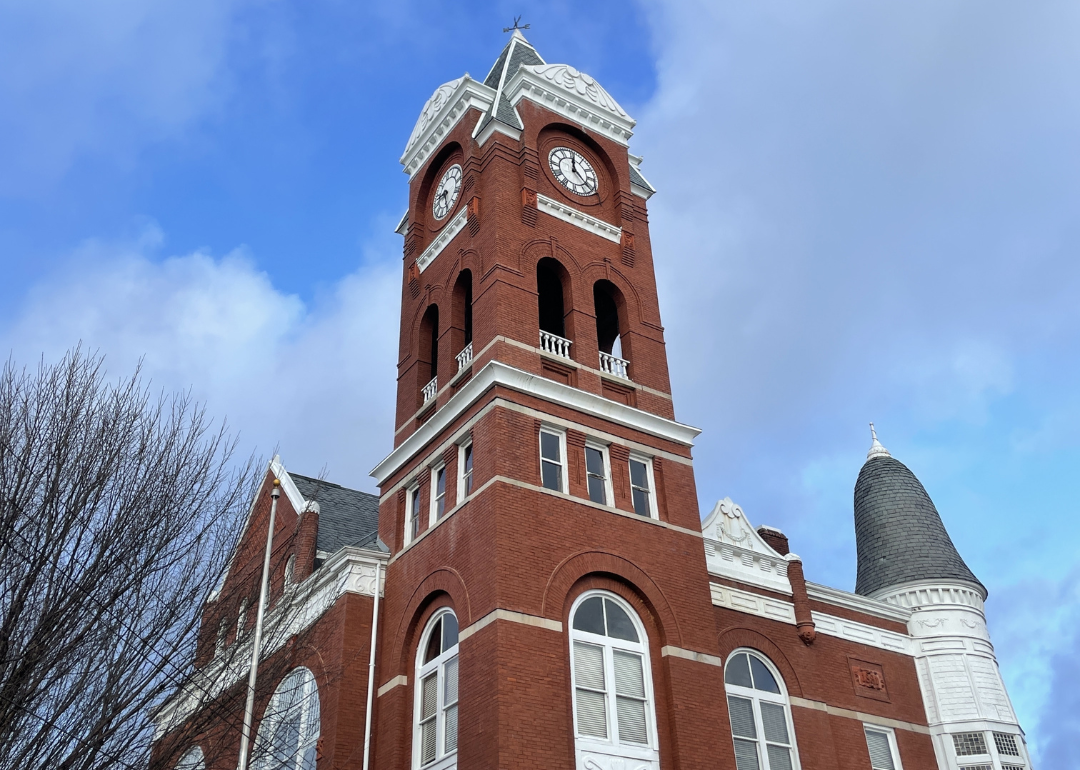
#16. Haralson County
– Five-year precipitation average: 63.90 inches
– Precipitation over the past year: 60.59 inches (#101 rainiest year since 1895)
– Precipitation compared to 1901-2000 average: 7.32 inches above norm
JNix // Shutterstock
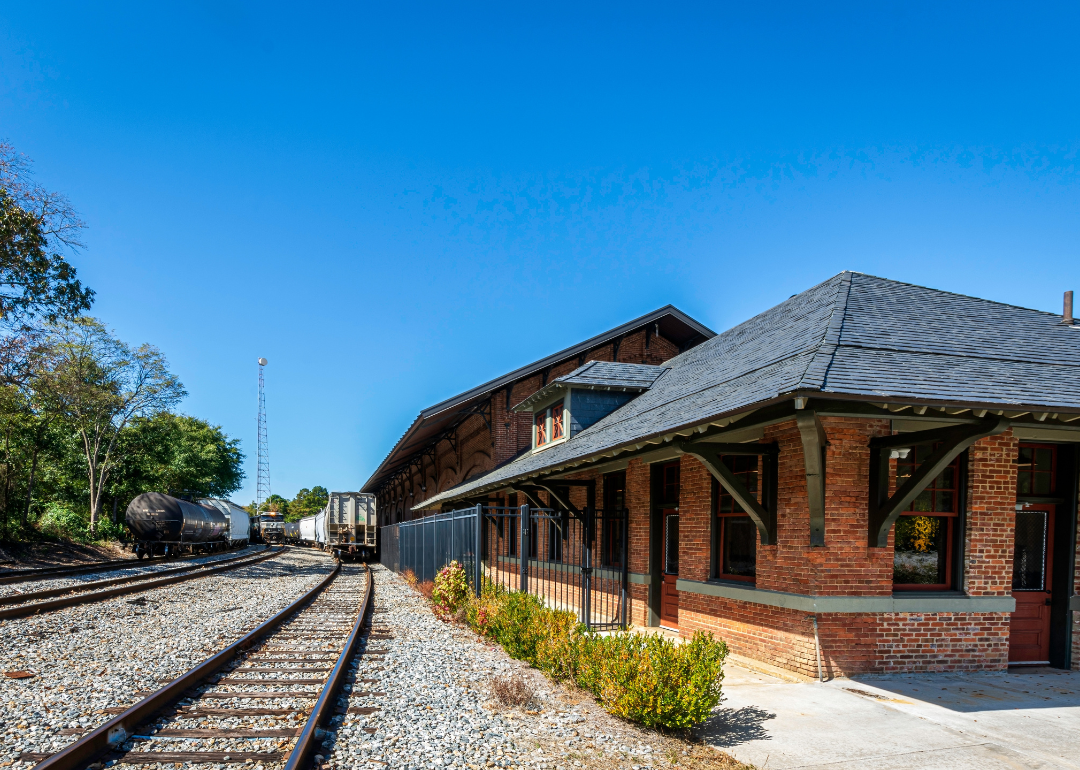
#15. Carroll County
– Five-year precipitation average: 64.79 inches
– Precipitation over the past year: 61.09 inches (#102 rainiest year since 1895)
– Precipitation compared to 1901-2000 average: 7.53 inches above norm
Canva
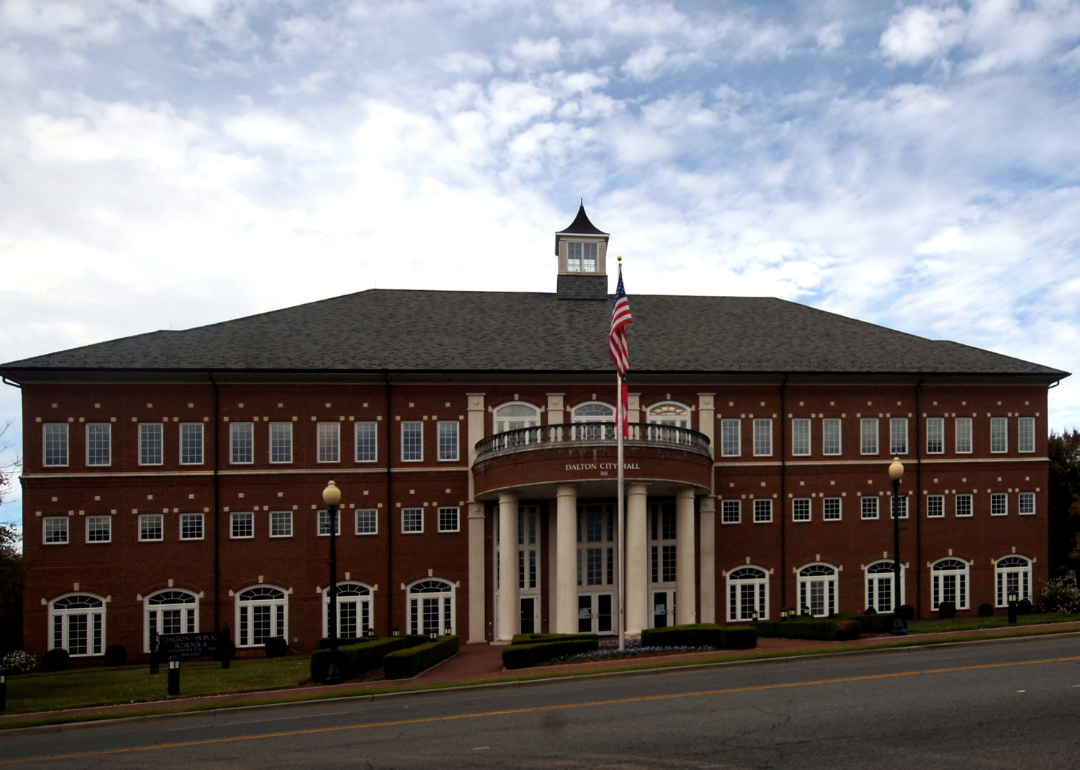
#14. Whitfield County
– Five-year precipitation average: 64.89 inches
– Precipitation over the past year: 53.18 inches (#64 rainiest year since 1895)
– Precipitation compared to 1901-2000 average: -0.47 inches below norm
Canva
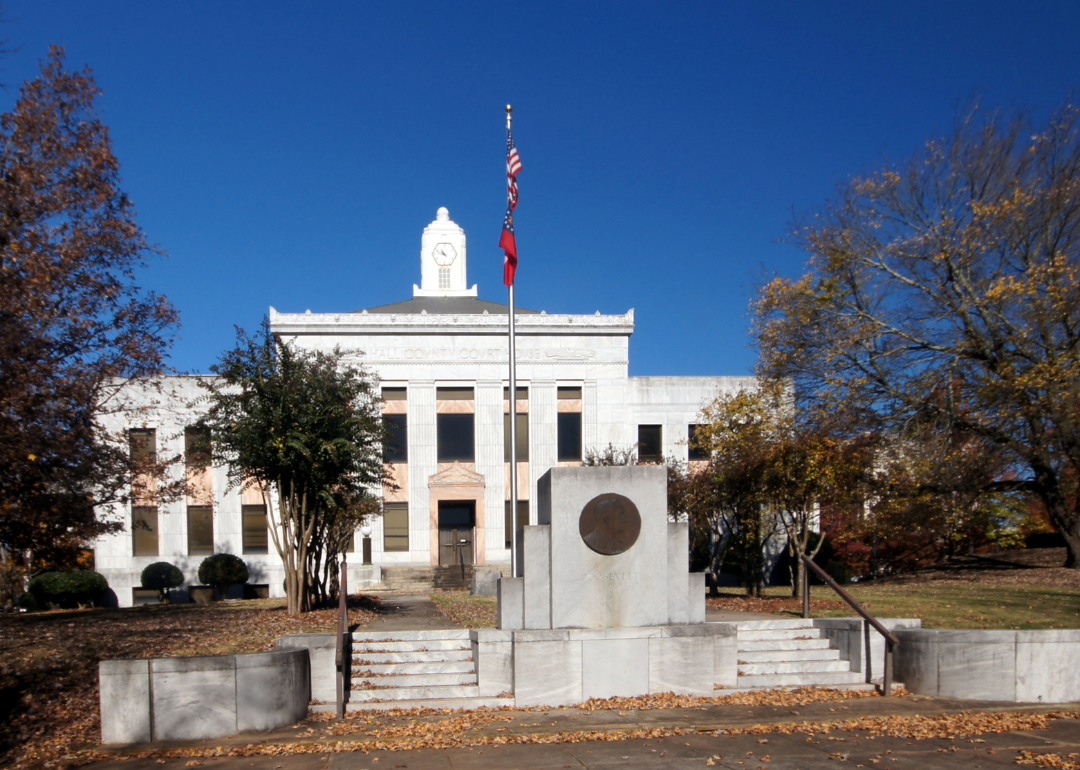
#13. Hall County
– Five-year precipitation average: 65.10 inches
– Precipitation over the past year: 56.86 inches (#77 rainiest year since 1895)
– Precipitation compared to 1901-2000 average: 2.16 inches above norm
JNix // Shutterstock
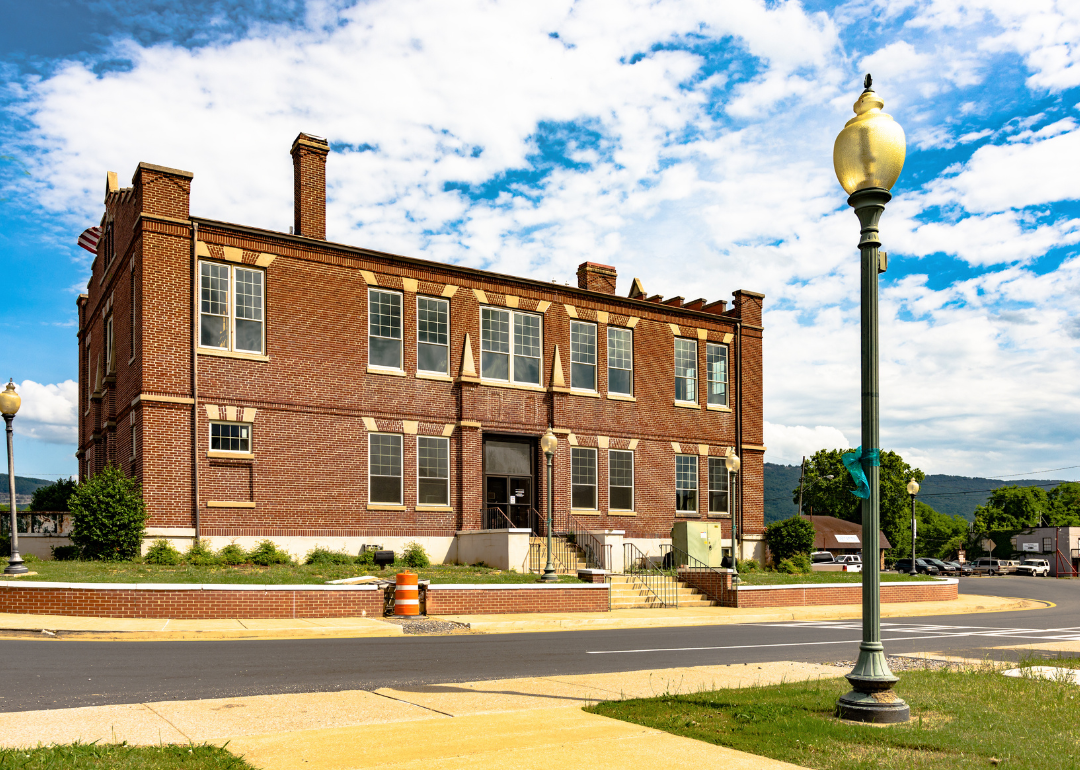
#12. Dade County
– Five-year precipitation average: 65.33 inches
– Precipitation over the past year: 56.04 inches (#77 rainiest year since 1895)
– Precipitation compared to 1901-2000 average: 1.88 inches above norm
Thomas Barrat // Shutterstock
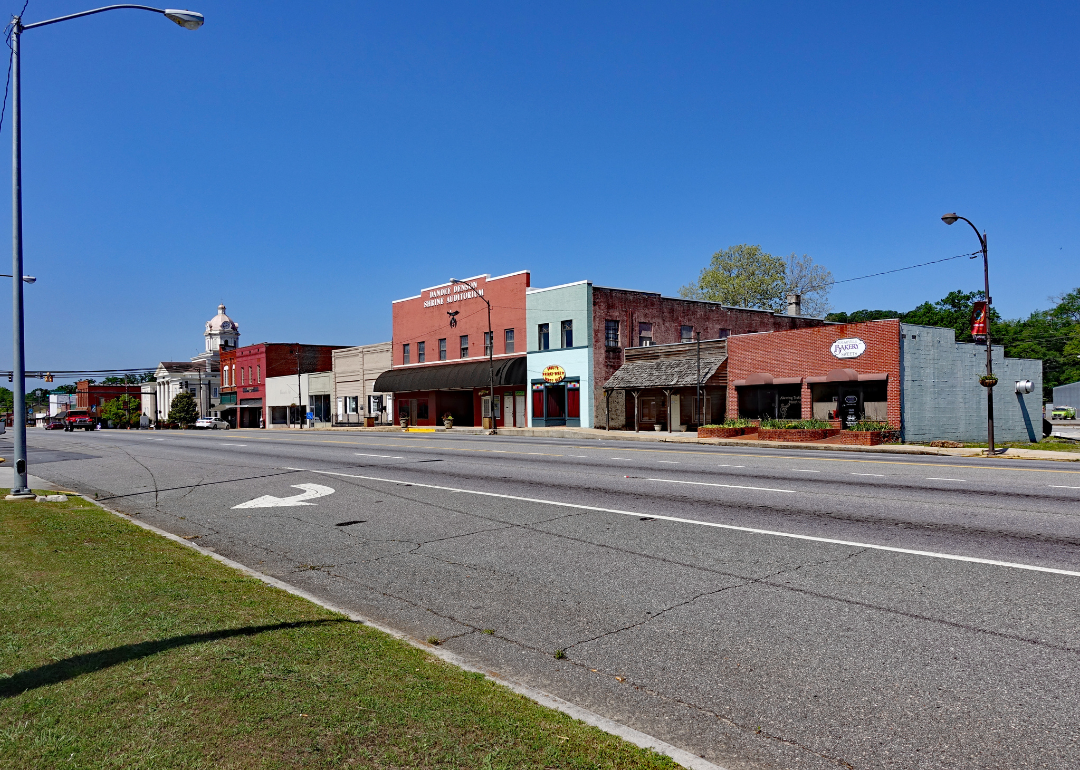
#11. Chattooga County
– Five-year precipitation average: 65.76 inches
– Precipitation over the past year: 56.77 inches (#75 rainiest year since 1895)
– Precipitation compared to 1901-2000 average: 1.87 inches above norm
Canva
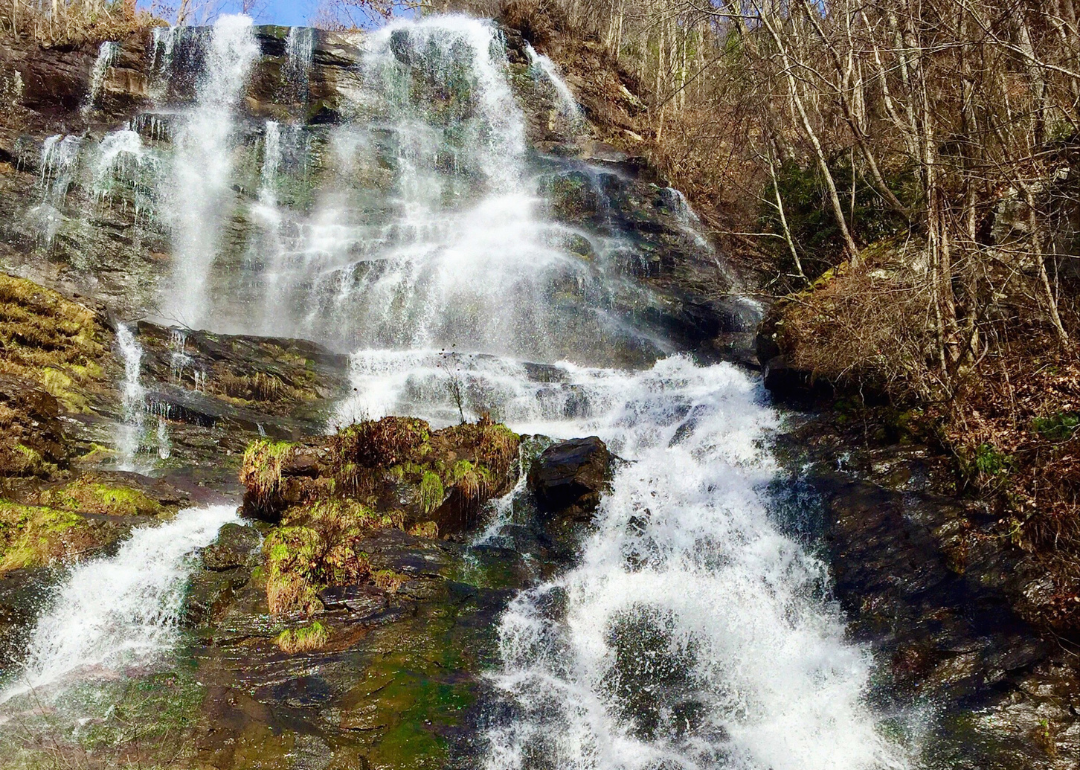
#10. Dawson County
– Five-year precipitation average: 68.17 inches
– Precipitation over the past year: 57.90 inches (#56 rainiest year since 1895)
– Precipitation compared to 1901-2000 average: -1.51 inches below norm
Jeff Kinsey // Shutterstock
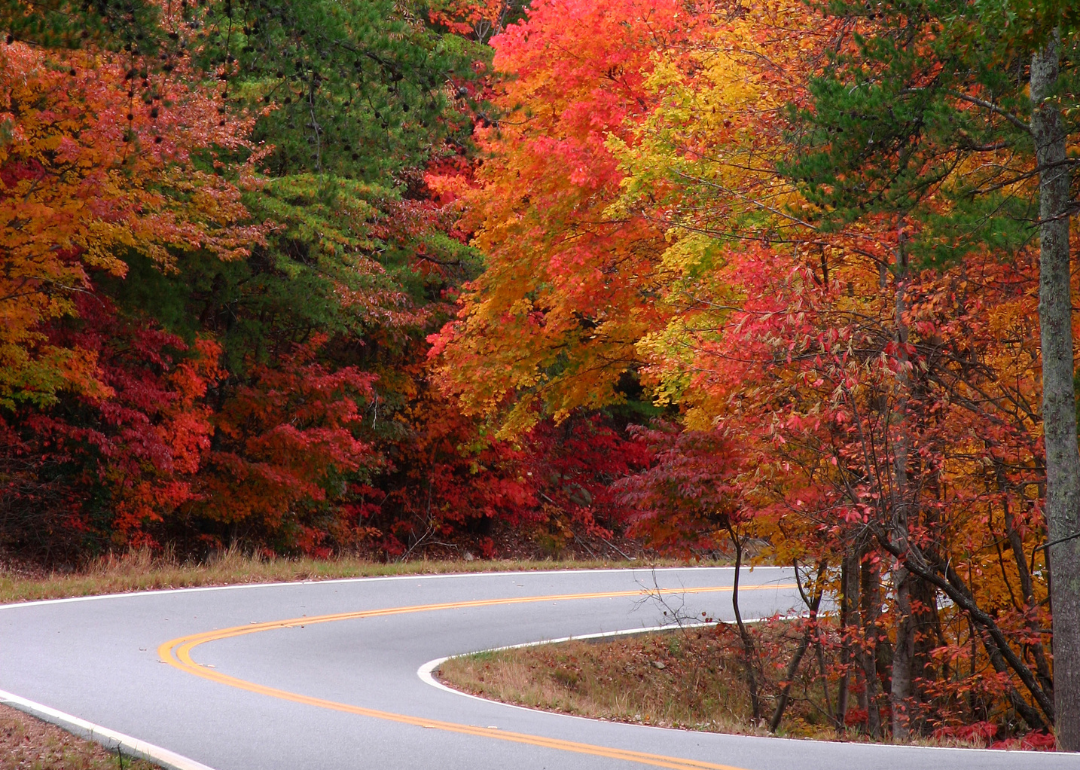
#9. Murray County
– Five-year precipitation average: 71.62 inches
– Precipitation over the past year: 56.16 inches (#66 rainiest year since 1895)
– Precipitation compared to 1901-2000 average: -0.10 inches below norm
Canva
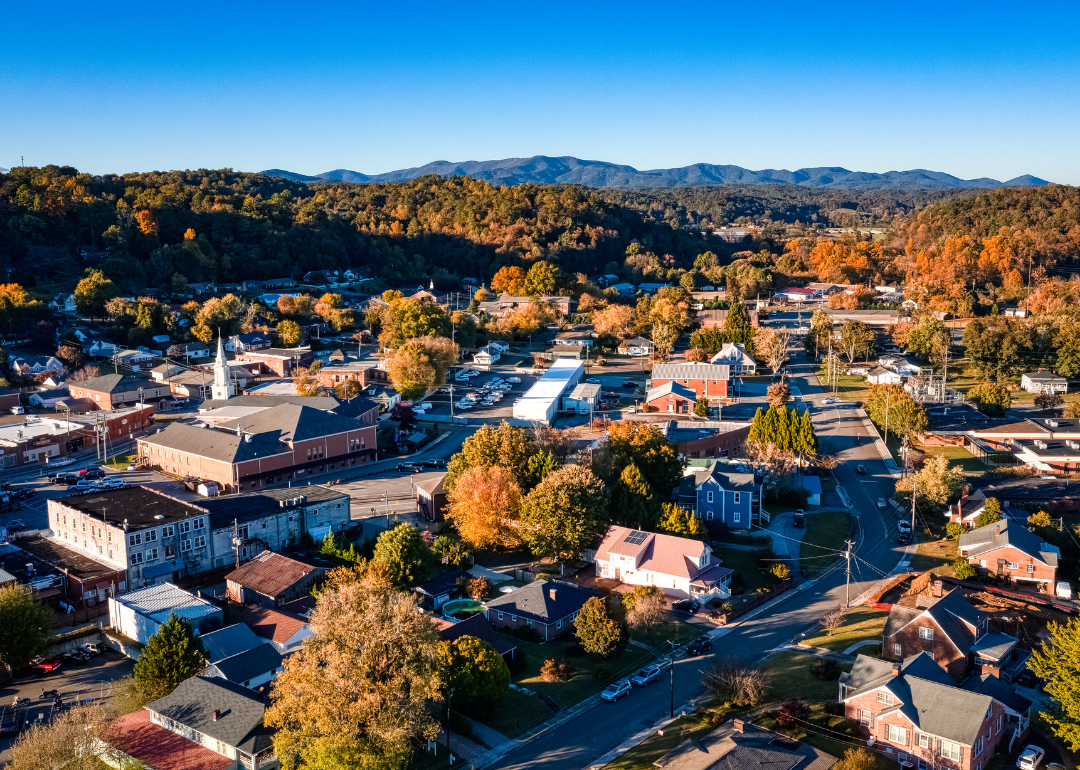
#8. Gilmer County
– Five-year precipitation average: 72.42 inches
– Precipitation over the past year: 56.67 inches (#39 rainiest year since 1895)
– Precipitation compared to 1901-2000 average: -4.87 inches below norm
Canva
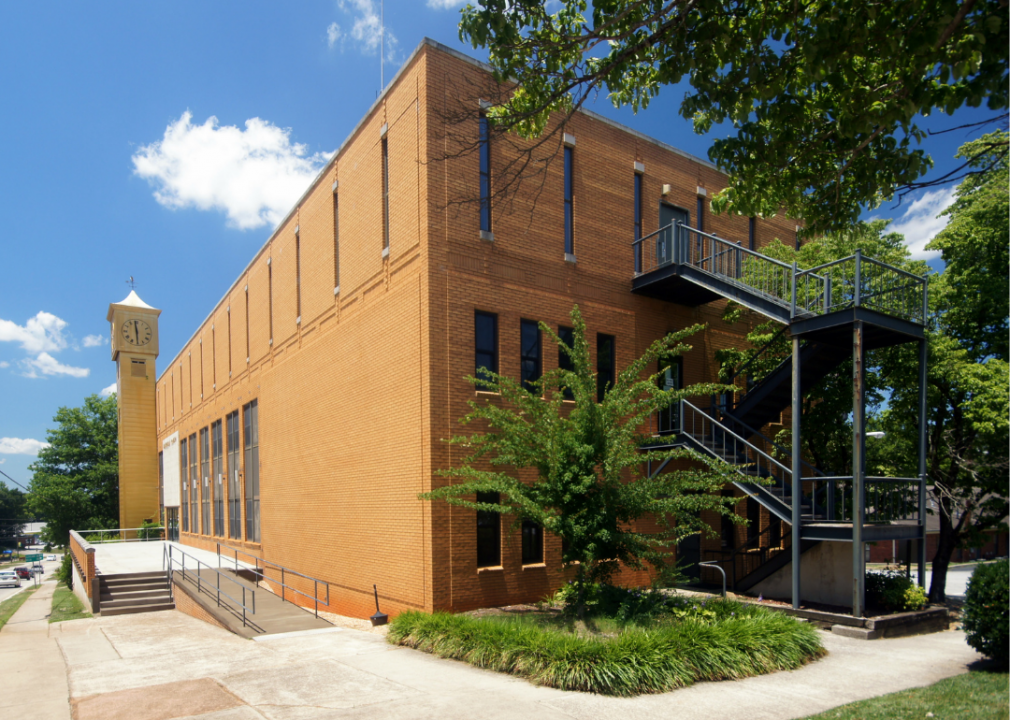
#7. Habersham County
– Five-year precipitation average: 73.20 inches
– Precipitation over the past year: 58.72 inches (#42 rainiest year since 1895)
– Precipitation compared to 1901-2000 average: -4.98 inches below norm

Canva
#6. Fannin County
– Five-year precipitation average: 73.22 inches
– Precipitation over the past year: 58.09 inches (#54 rainiest year since 1895)
– Precipitation compared to 1901-2000 average: -1.95 inches below norm
Canva
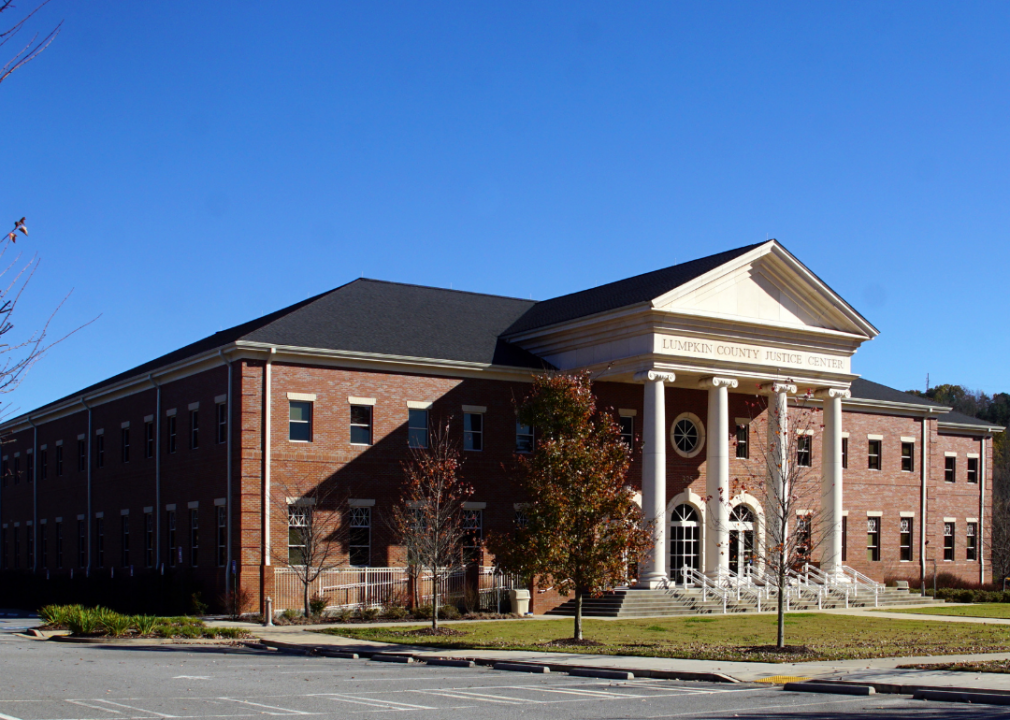
#5. Lumpkin County
– Five-year precipitation average: 75.03 inches
– Precipitation over the past year: 61.66 inches (#58 rainiest year since 1895)
– Precipitation compared to 1901-2000 average: -1.05 inches below norm
Canva
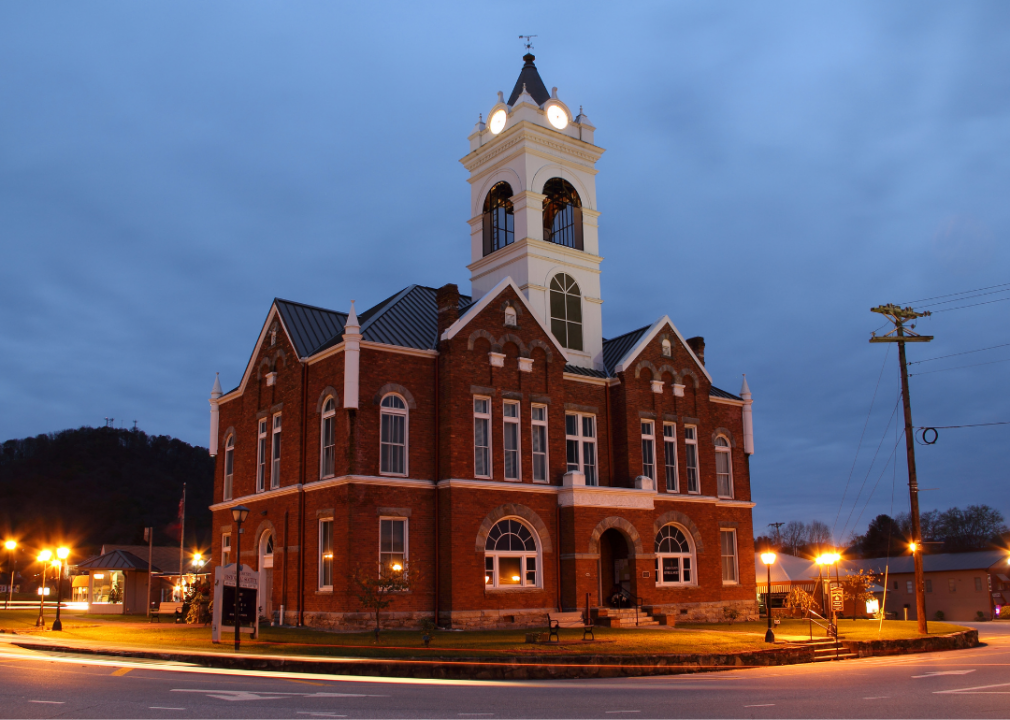
#4. Union County
– Five-year precipitation average: 75.20 inches
– Precipitation over the past year: 60.04 inches (#60 rainiest year since 1895)
– Precipitation compared to 1901-2000 average: -0.87 inches below norm
Canva
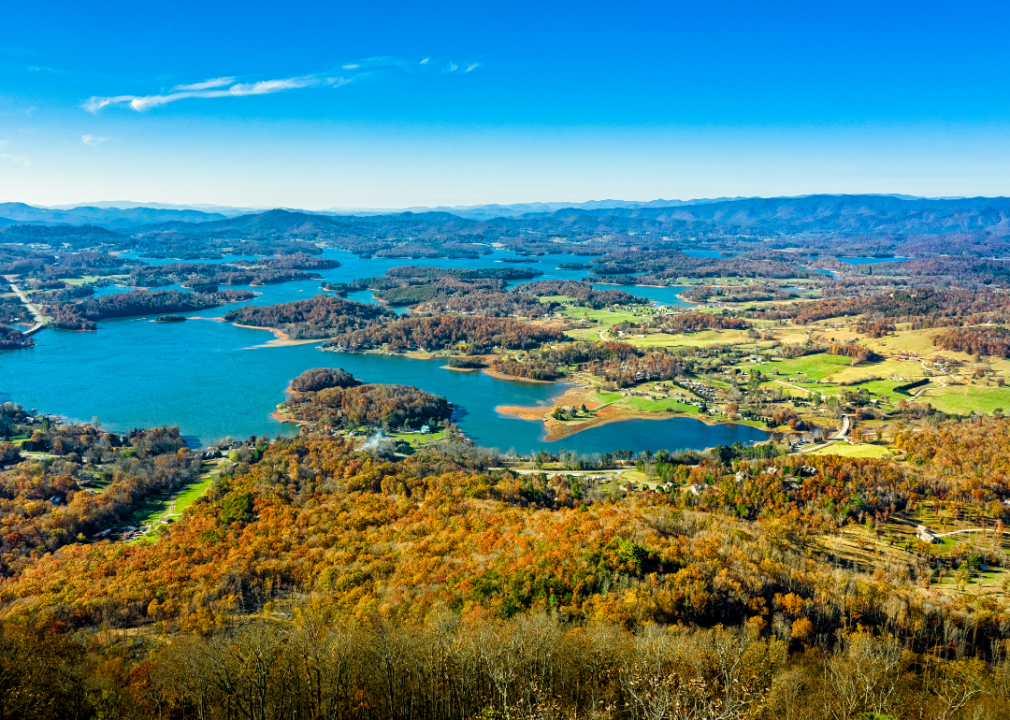
#3. Towns County
– Five-year precipitation average: 75.68 inches
– Precipitation over the past year: 60.66 inches (#50 rainiest year since 1895)
– Precipitation compared to 1901-2000 average: -2.27 inches below norm
Canva
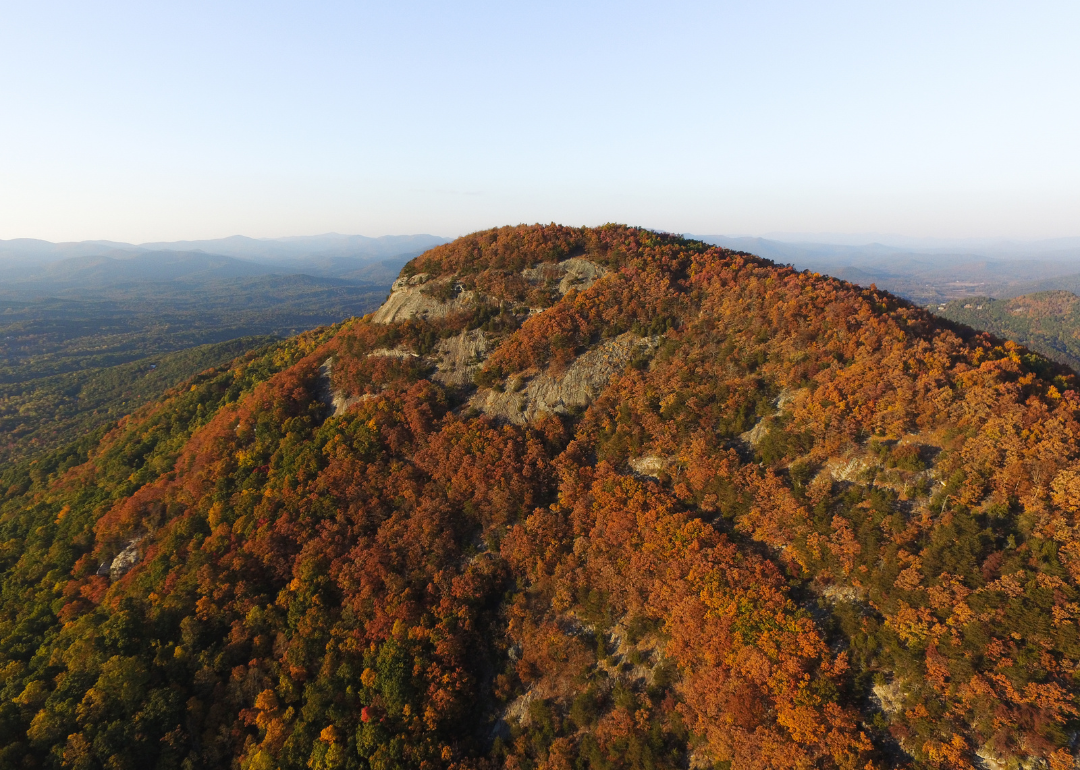
#2. White County
– Five-year precipitation average: 77.50 inches
– Precipitation over the past year: 62.85 inches (#55 rainiest year since 1895)
– Precipitation compared to 1901-2000 average: -1.17 inches below norm
Canva
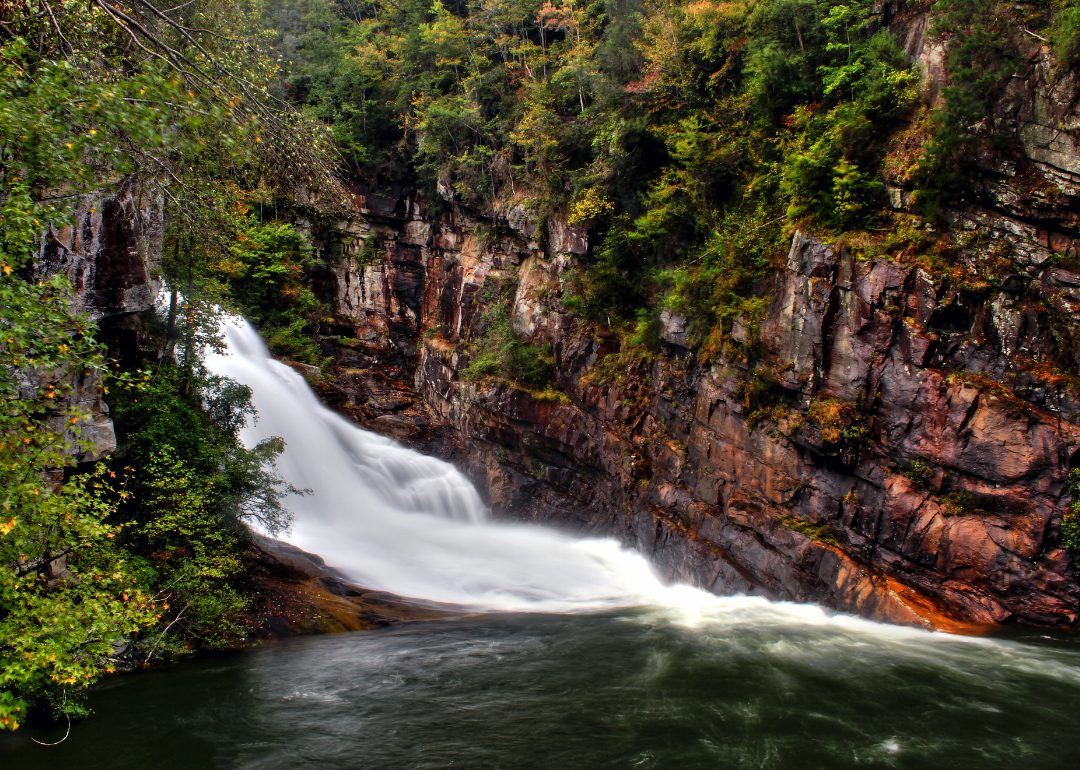
#1. Rabun County
– Five-year precipitation average: 79.51 inches
– Precipitation over the past year: 65.70 inches (#48 rainiest year since 1895)
– Precipitation compared to 1901-2000 average: -3.66 inches below norm