

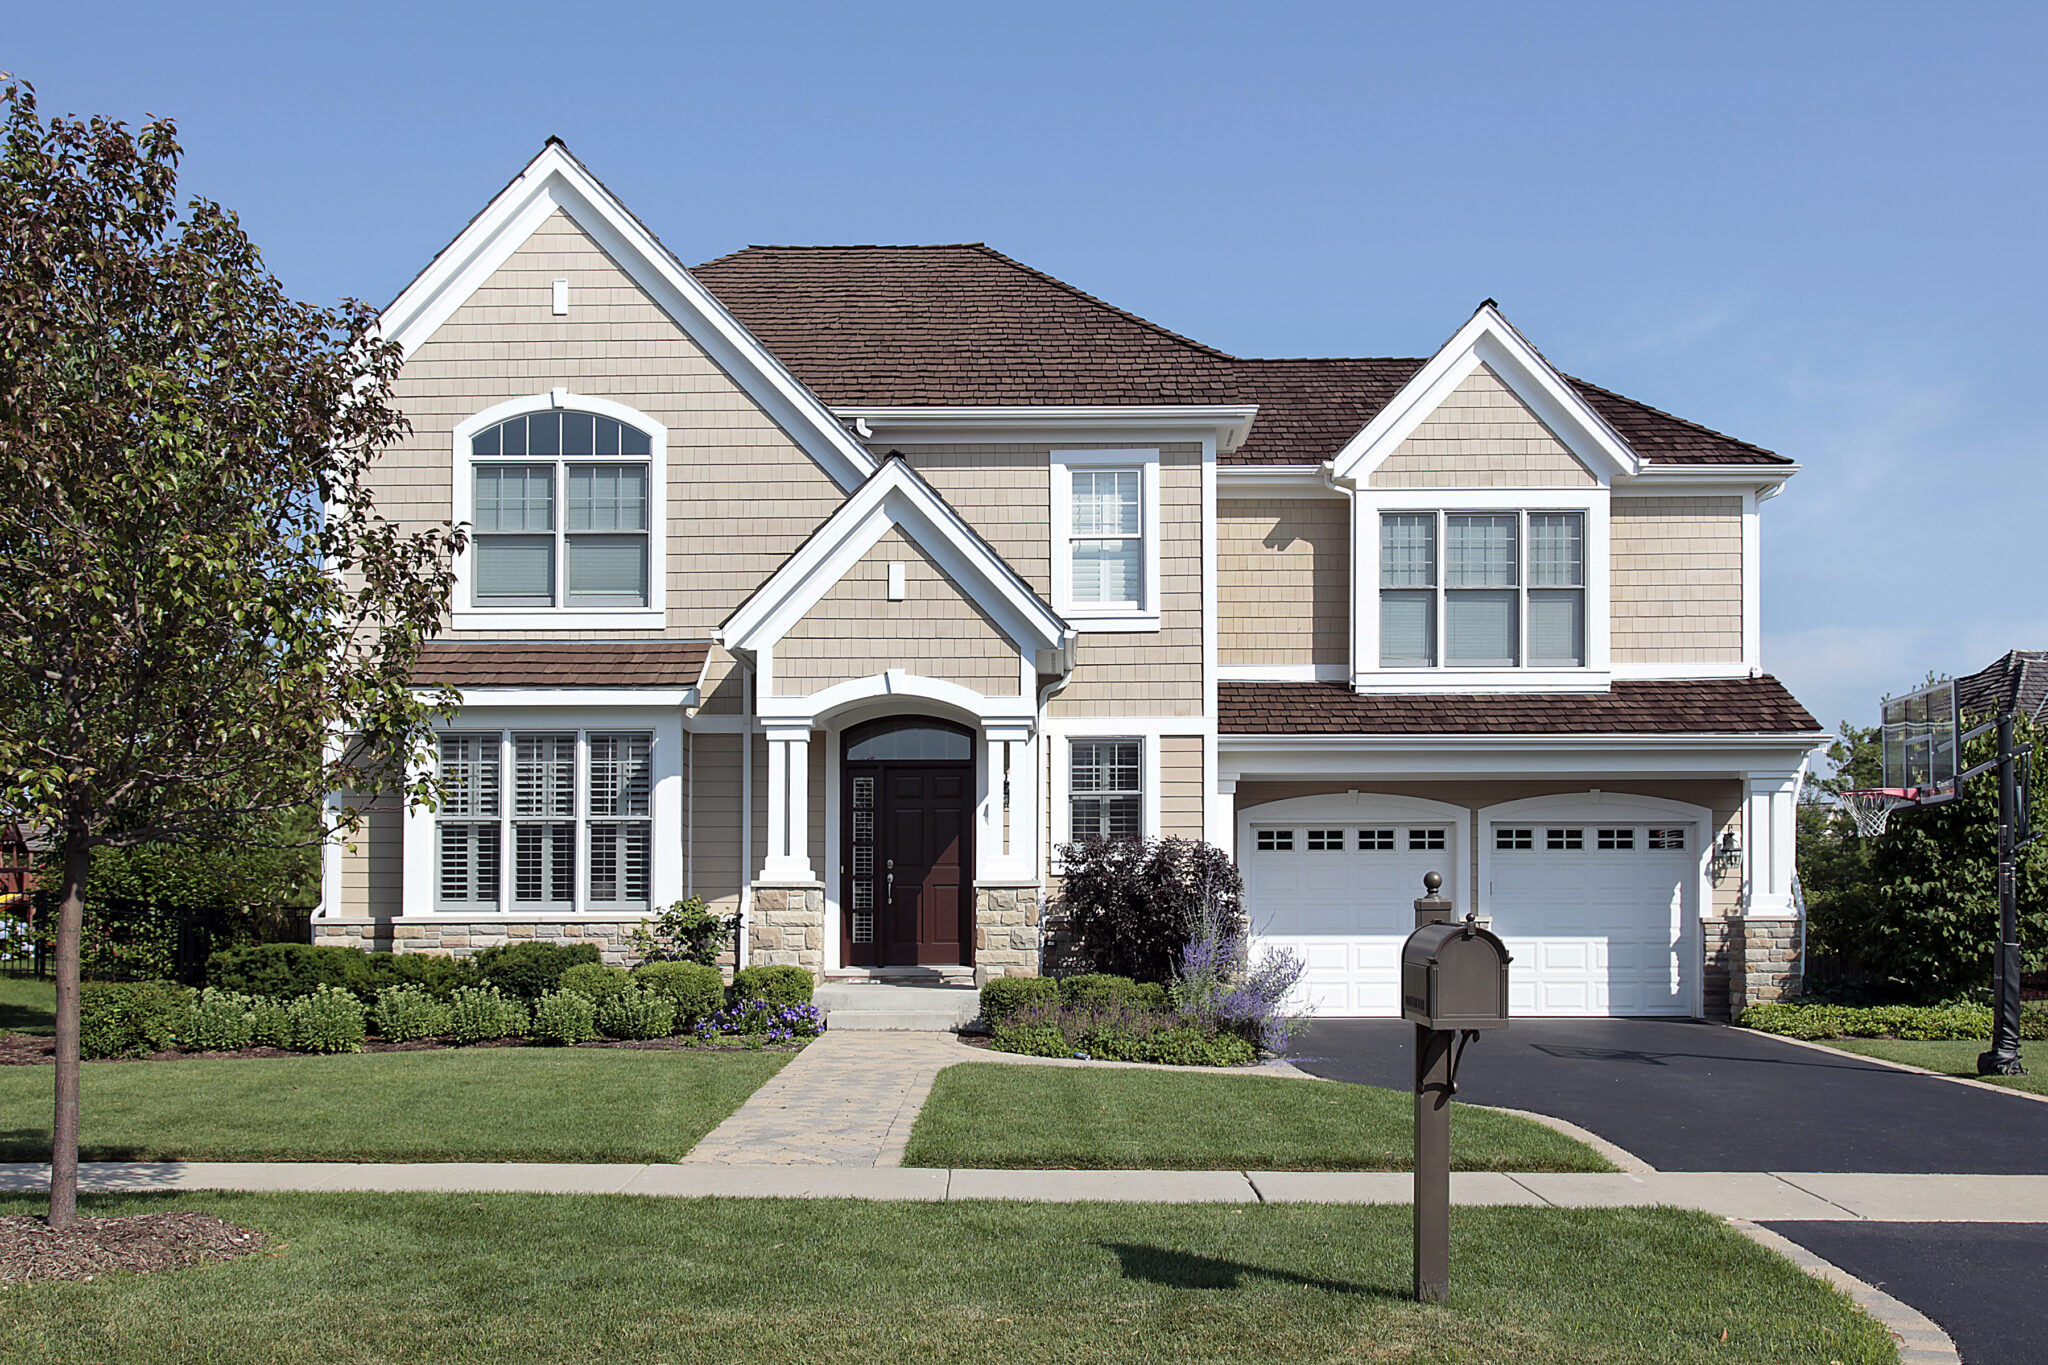
Stacker compiled a list of cities with the most expensive homes in Georgia using data from Zillow. Cities are ranked by the Zillow Home Values Index for all homes as of June 2022. The charts in this story were created automatically using Matplotlib. The most expensive city on the list has a typical home value of $4,047,232 which is 1,178% higher than the state average of $316,705.
Metros with the most cities in the top 30 in Georgia
#1. Atlanta-Sandy Springs-Roswell: 21
#2. Savannah: 3
#3. Brunswick: 2
#4. Athens-Clarke County: 1
#4. Jefferson: 1
Read on to see which cities made the list.
You may also like: Best places to live in Georgia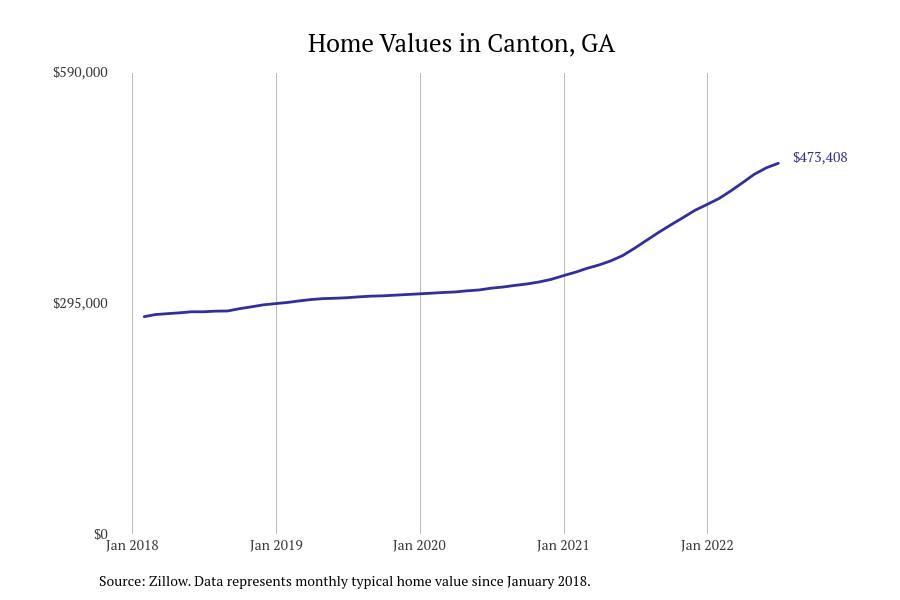
Stacker
#30. Canton
– Typical home value: $473,408
– 1-year price change: +29.7%
– 5-year price change: +80.0%
– Metro area: Atlanta-Sandy Springs-Roswell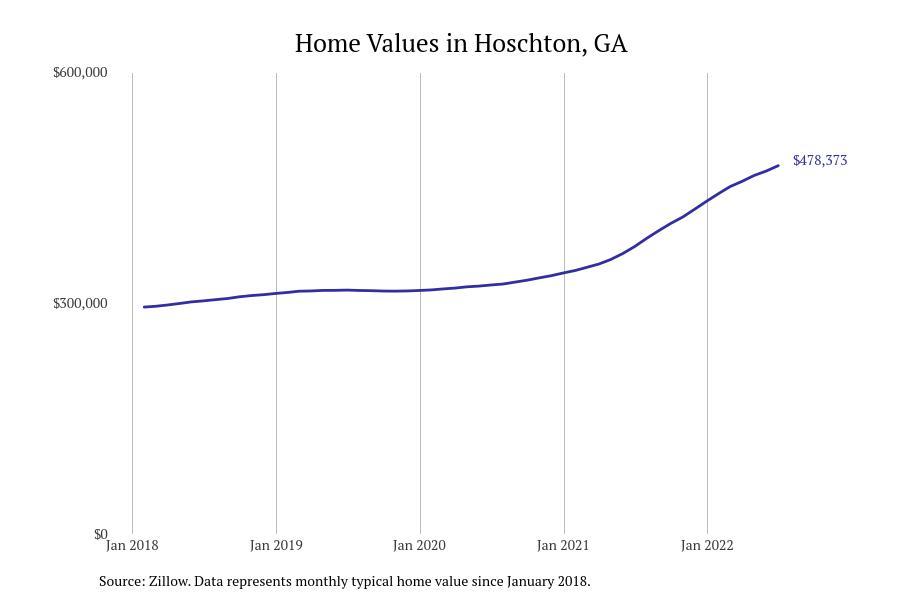
Stacker
#29. Hoschton
– Typical home value: $478,373
– 1-year price change: +28.1%
– 5-year price change: +68.2%
– Metro area: Jefferson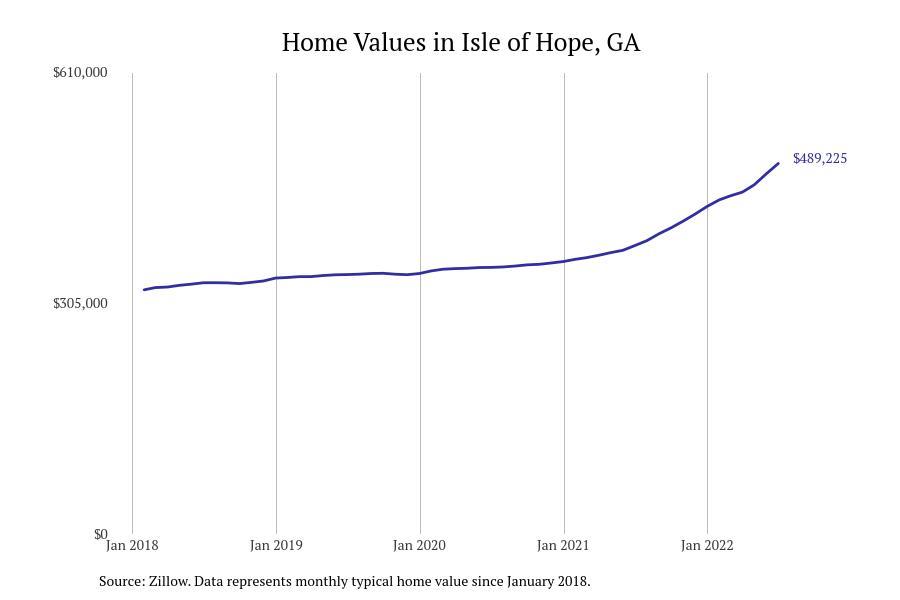
Stacker
#28. Isle of Hope
– Typical home value: $489,225
– 1-year price change: +28.5%
– 5-year price change: +58.4%
– Metro area: Savannah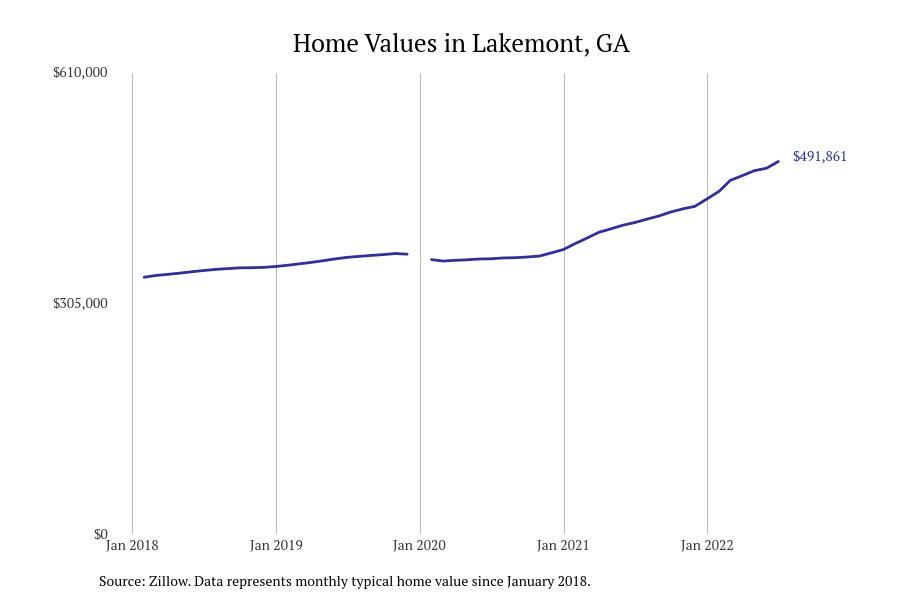
Stacker
#27. Lakemont
– Typical home value: $491,861
– 1-year price change: +19.6%
– 5-year price change: +50.1%
– Metro area: not in a metro area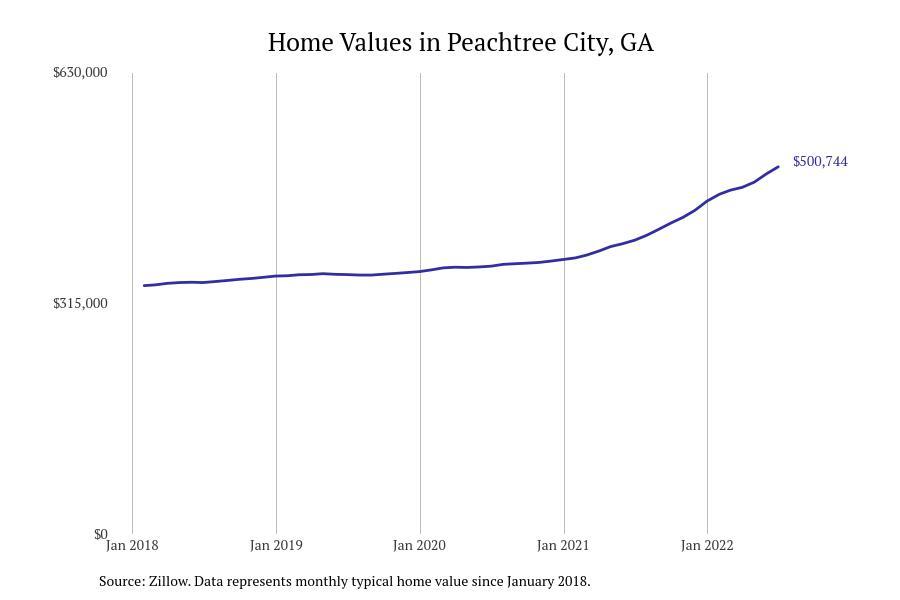
Stacker
#26. Peachtree City
– Typical home value: $500,744
– 1-year price change: +25.0%
– 5-year price change: +51.7%
– Metro area: Atlanta-Sandy Springs-Roswell
You may also like: Georgia is the #6 state with the most rural hospital closures since 2005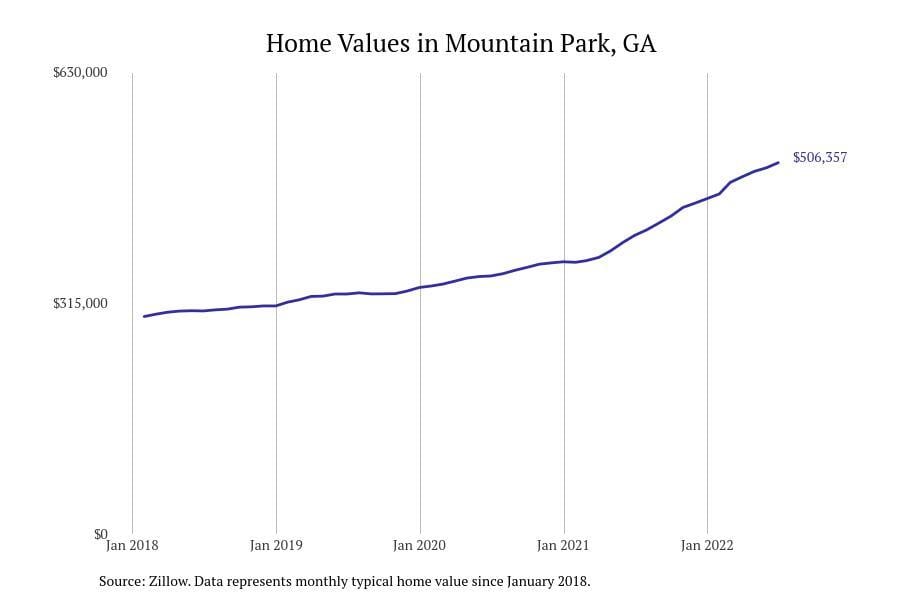
Stacker
#25. Mountain Park
– Typical home value: $506,357
– 1-year price change: +24.3%
– 5-year price change: +78.6%
– Metro area: Atlanta-Sandy Springs-Roswell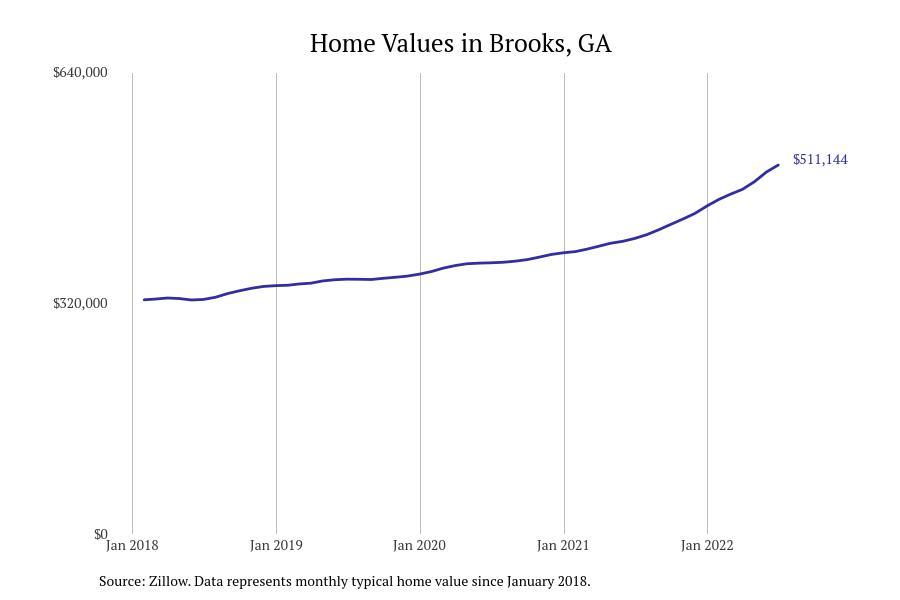
Stacker
#24. Brooks
– Typical home value: $511,144
– 1-year price change: +24.9%
– 5-year price change: +59.7%
– Metro area: Atlanta-Sandy Springs-Roswell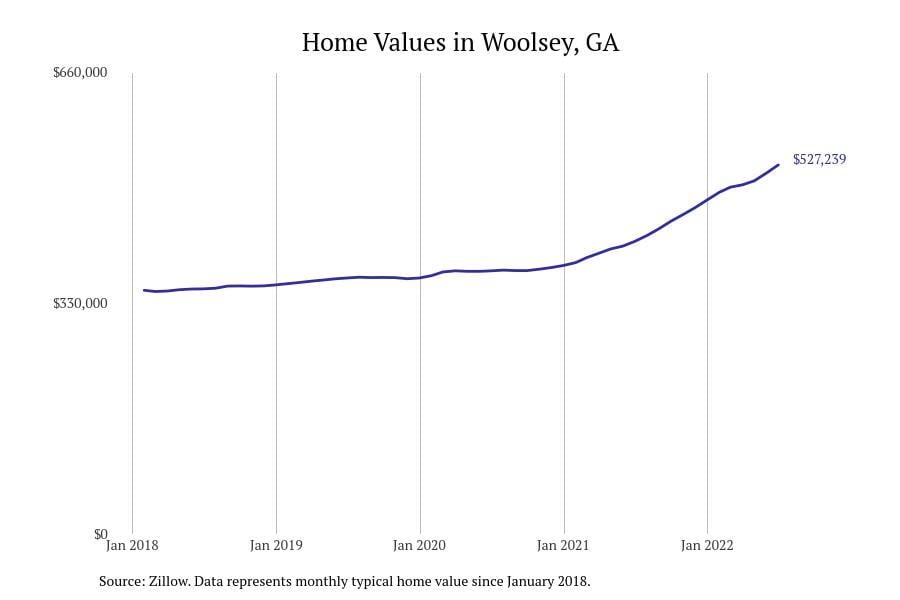
Stacker
#23. Woolsey
– Typical home value: $527,239
– 1-year price change: +26.2%
– 5-year price change: +59.7%
– Metro area: Atlanta-Sandy Springs-Roswell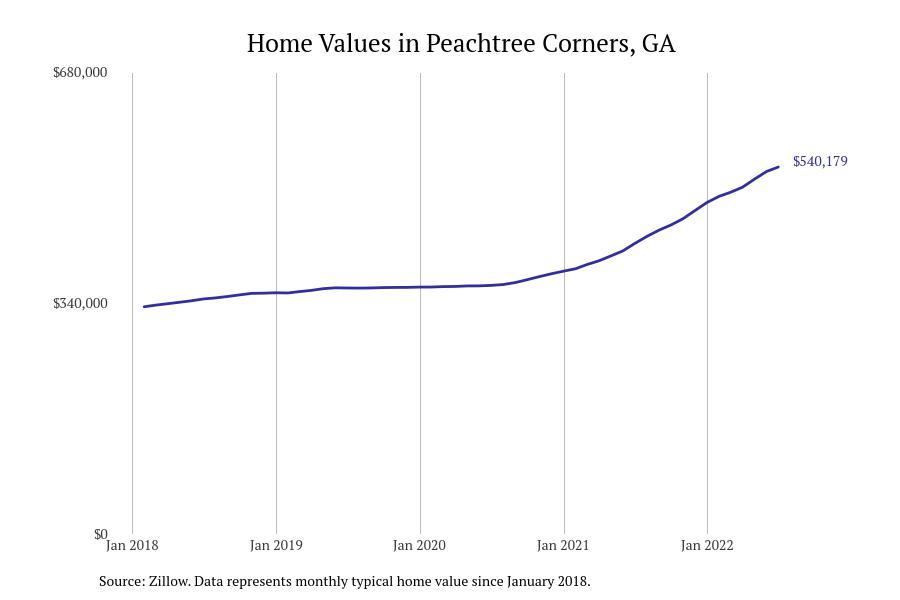
Stacker
#22. Peachtree Corners
– Typical home value: $540,179
– 1-year price change: +26.4%
– 5-year price change: +66.9%
– Metro area: Atlanta-Sandy Springs-Roswell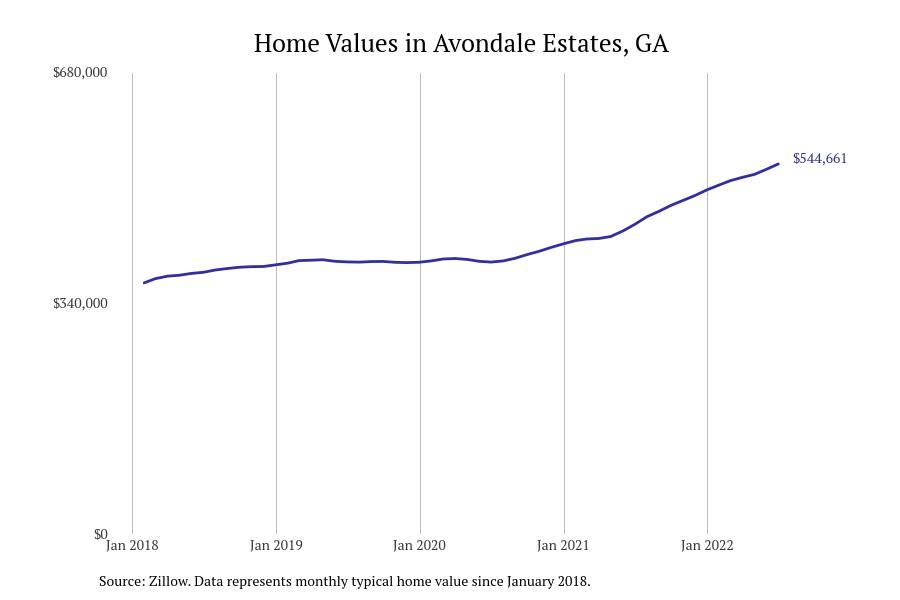
Stacker
#21. Avondale Estates
– Typical home value: $544,661
– 1-year price change: +19.5%
– 5-year price change: +57.6%
– Metro area: Atlanta-Sandy Springs-Roswell
You may also like: Best public high schools in Georgia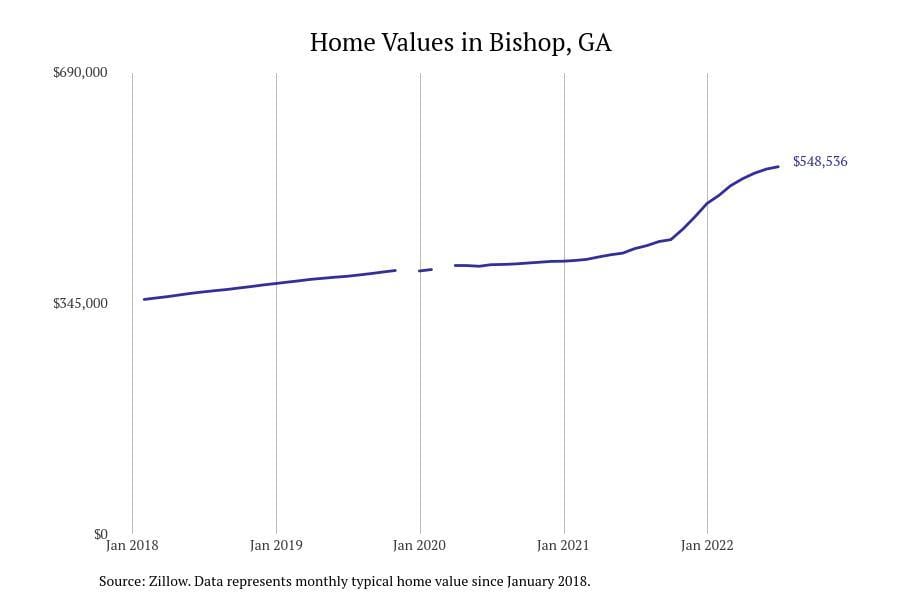
Stacker
#20. Bishop
– Typical home value: $548,536
– 1-year price change: +28.7%
– 5-year price change: +64.0%
– Metro area: Athens-Clarke County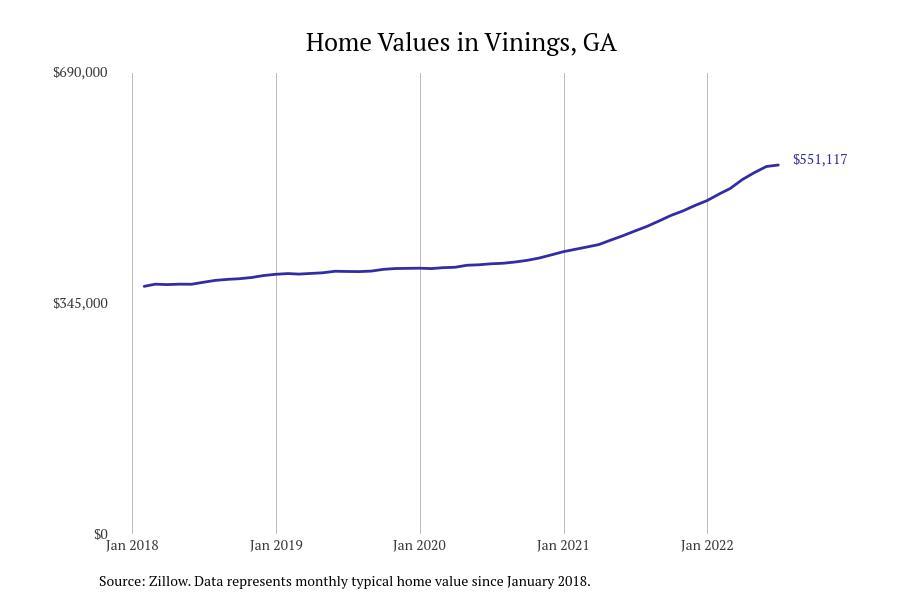
Stacker
#19. Vinings
– Typical home value: $551,117
– 1-year price change: +21.8%
– 5-year price change: +56.3%
– Metro area: Atlanta-Sandy Springs-Roswell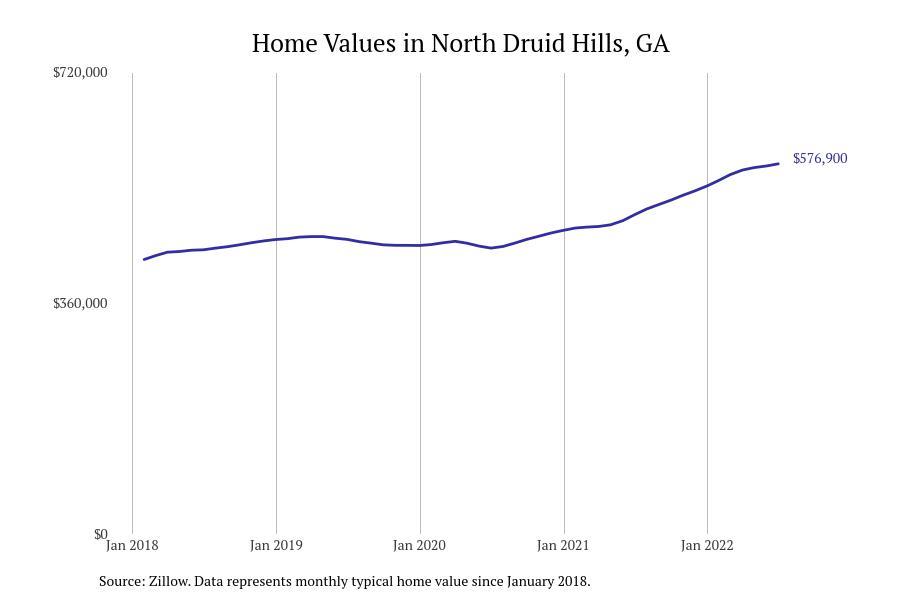
Stacker
#18. North Druid Hills
– Typical home value: $576,900
– 1-year price change: +15.9%
– 5-year price change: +42.0%
– Metro area: Atlanta-Sandy Springs-Roswell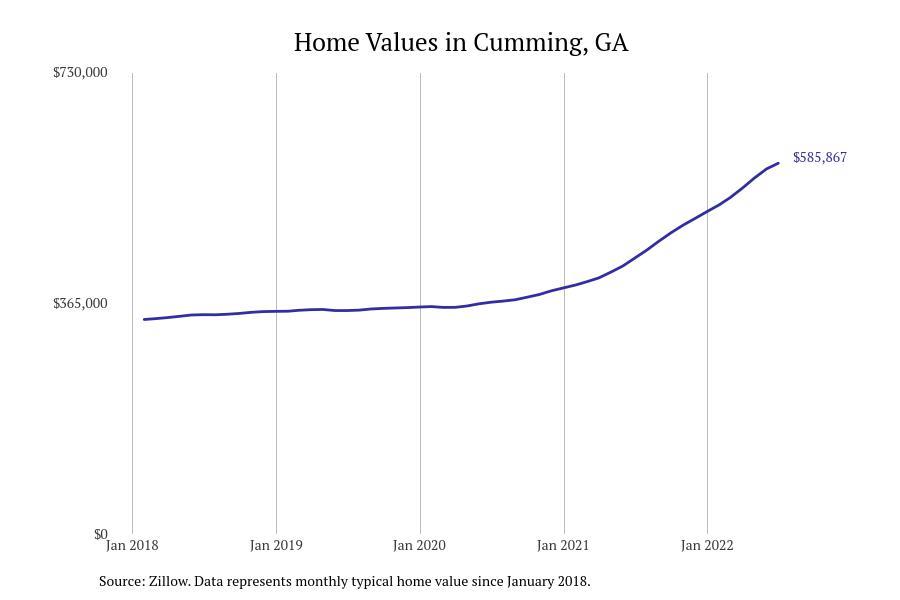
Stacker
#17. Cumming
– Typical home value: $585,867
– 1-year price change: +34.4%
– 5-year price change: +78.5%
– Metro area: Atlanta-Sandy Springs-Roswell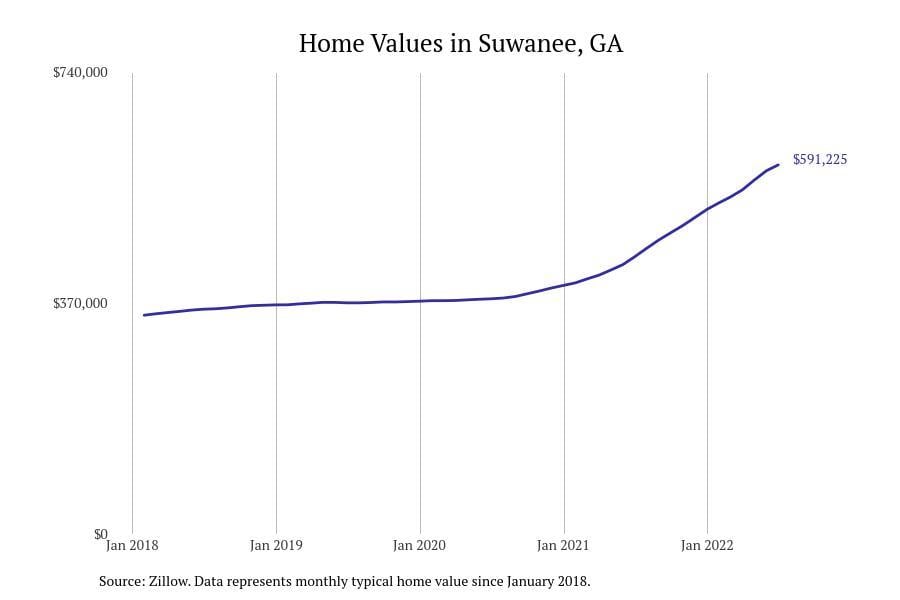
Stacker
#16. Suwanee
– Typical home value: $591,225
– 1-year price change: +33.2%
– 5-year price change: +73.4%
– Metro area: Atlanta-Sandy Springs-Roswell
You may also like: Cities with the most expensive homes in Georgia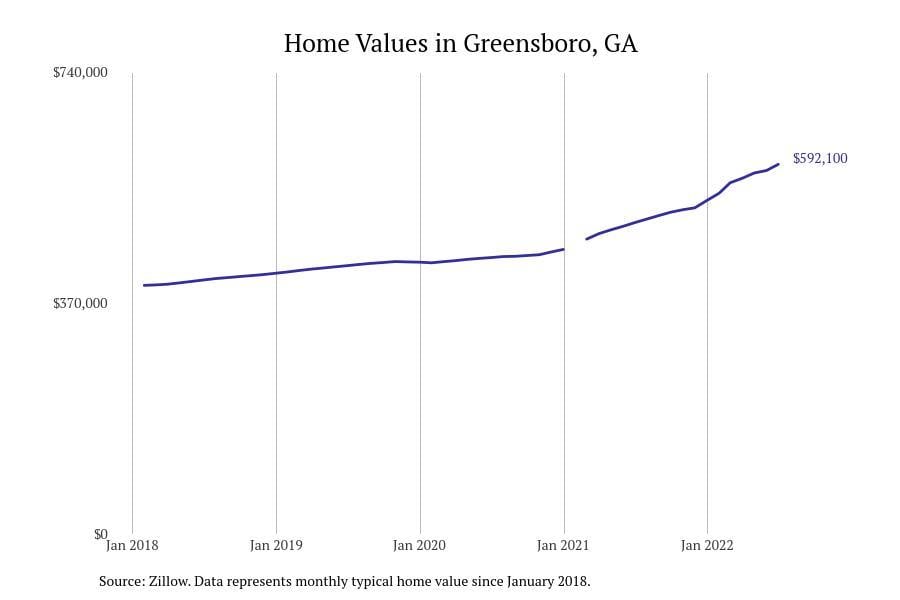
Stacker
#15. Greensboro
– Typical home value: $592,100
– 1-year price change: +18.7%
– 5-year price change: +52.9%
– Metro area: not in a metro area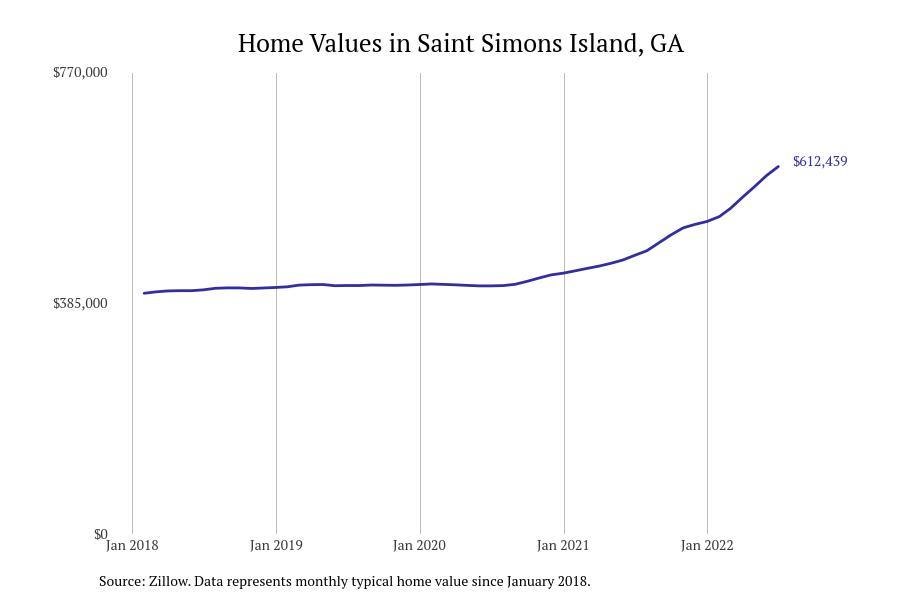
Stacker
#14. Saint Simons Island
– Typical home value: $612,439
– 1-year price change: +31.9%
– 5-year price change: +58.0%
– Metro area: Brunswick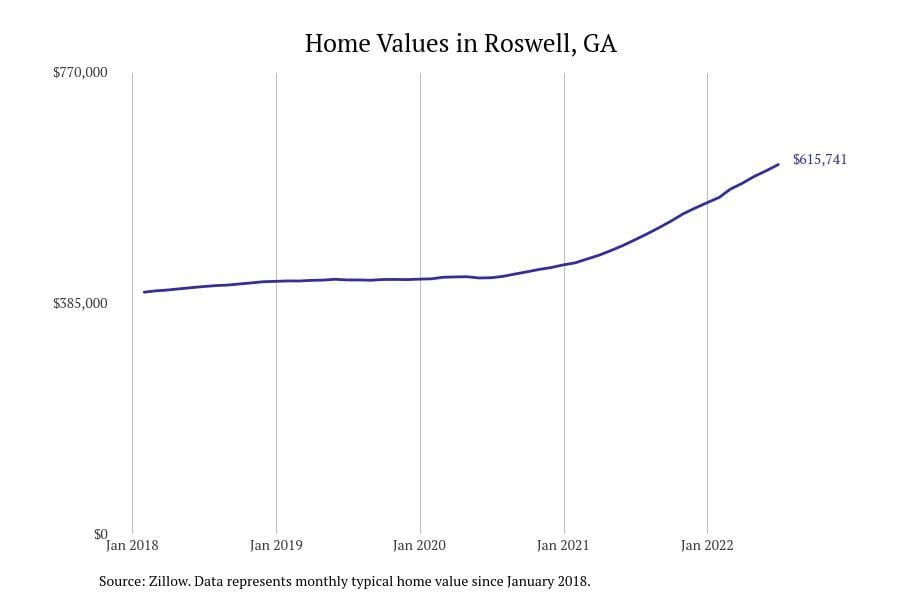
Stacker
#13. Roswell
– Typical home value: $615,741
– 1-year price change: +25.7%
– 5-year price change: +57.5%
– Metro area: Atlanta-Sandy Springs-Roswell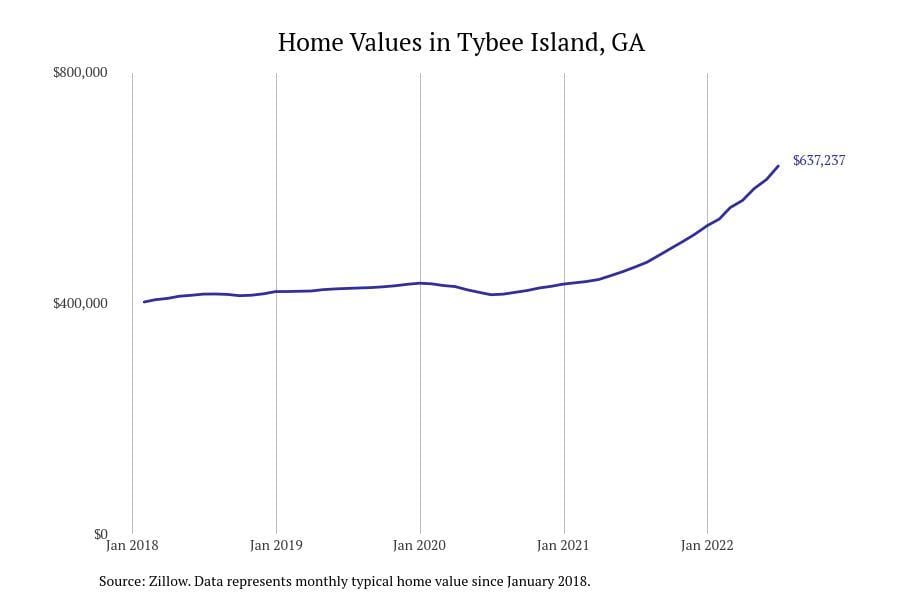
Stacker
#12. Tybee Island
– Typical home value: $637,237
– 1-year price change: +37.9%
– 5-year price change: +62.2%
– Metro area: Savannah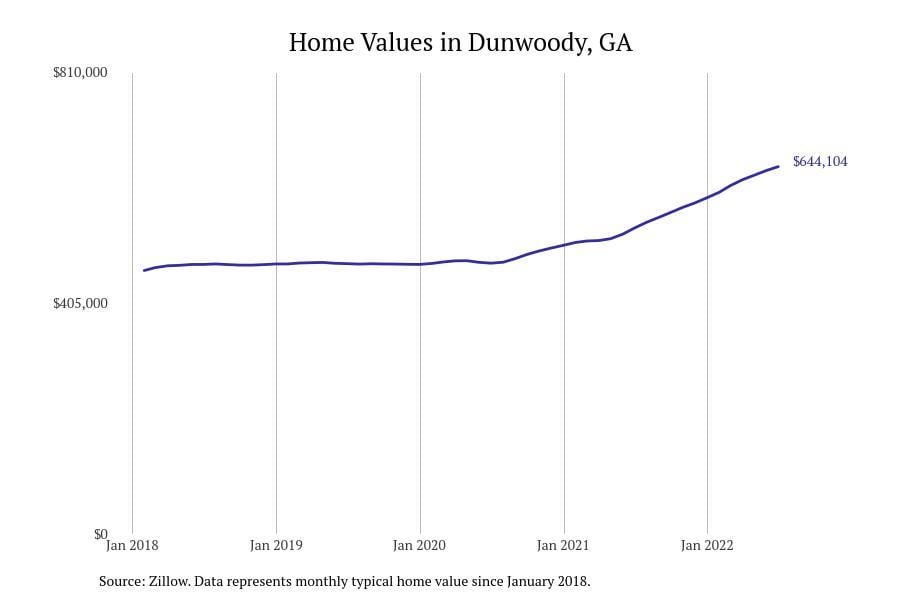
Stacker
#11. Dunwoody
– Typical home value: $644,104
– 1-year price change: +20.0%
– 5-year price change: +48.6%
– Metro area: Atlanta-Sandy Springs-Roswell
You may also like: Counties with the most born-and-bred residents in Georgia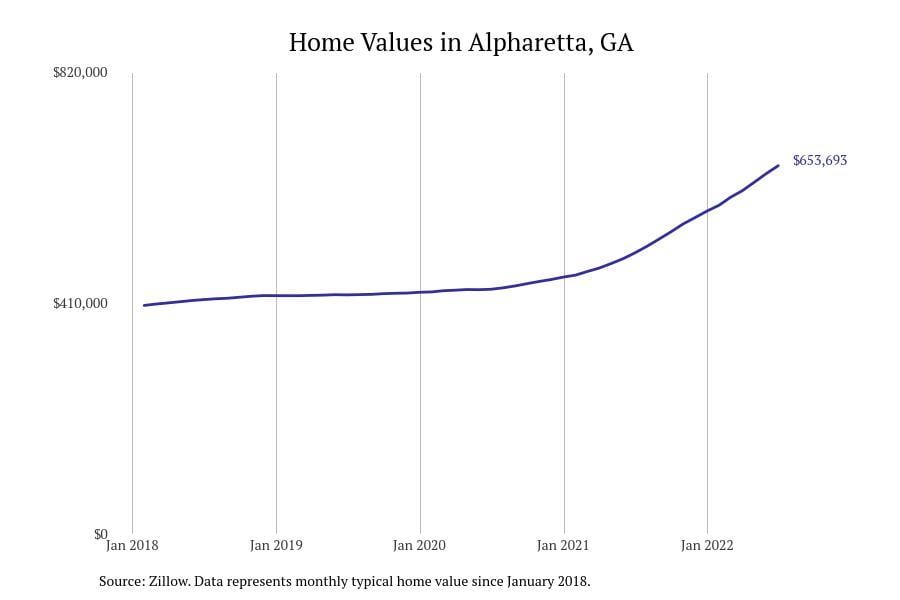
Stacker
#10. Alpharetta
– Typical home value: $653,693
– 1-year price change: +31.1%
– 5-year price change: +67.0%
– Metro area: Atlanta-Sandy Springs-Roswell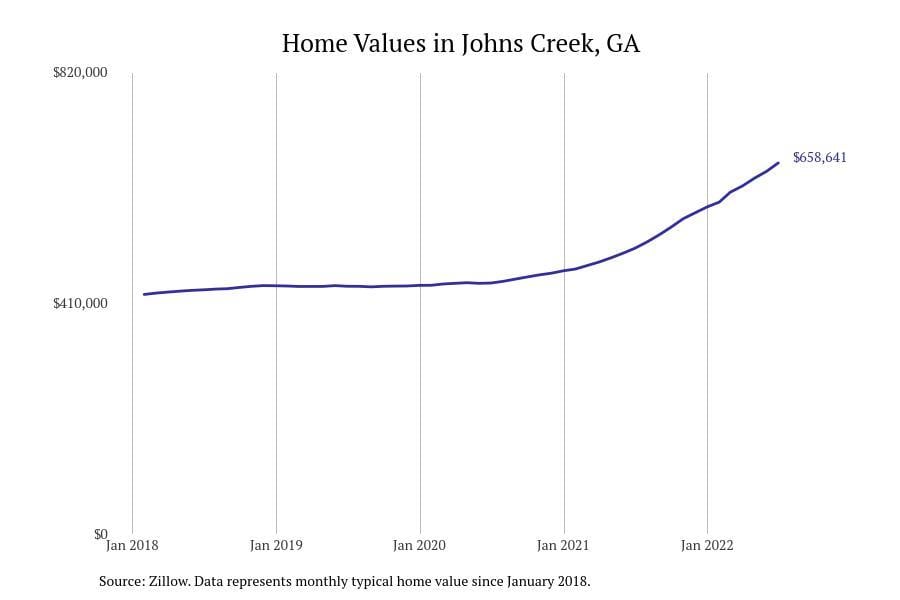
Stacker
#9. Johns Creek
– Typical home value: $658,641
– 1-year price change: +29.9%
– 5-year price change: +59.6%
– Metro area: Atlanta-Sandy Springs-Roswell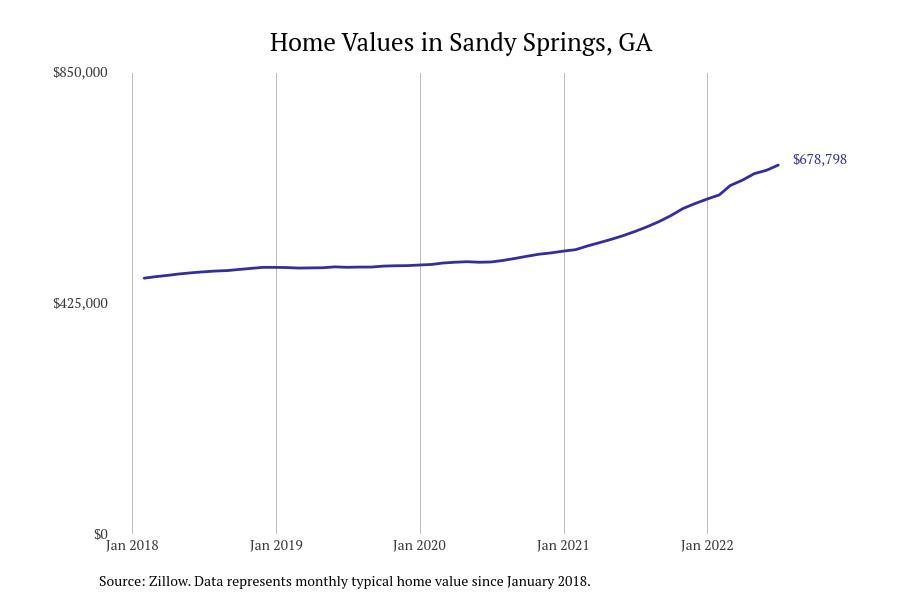
Stacker
#8. Sandy Springs
– Typical home value: $678,798
– 1-year price change: +22.0%
– 5-year price change: +50.1%
– Metro area: Atlanta-Sandy Springs-Roswell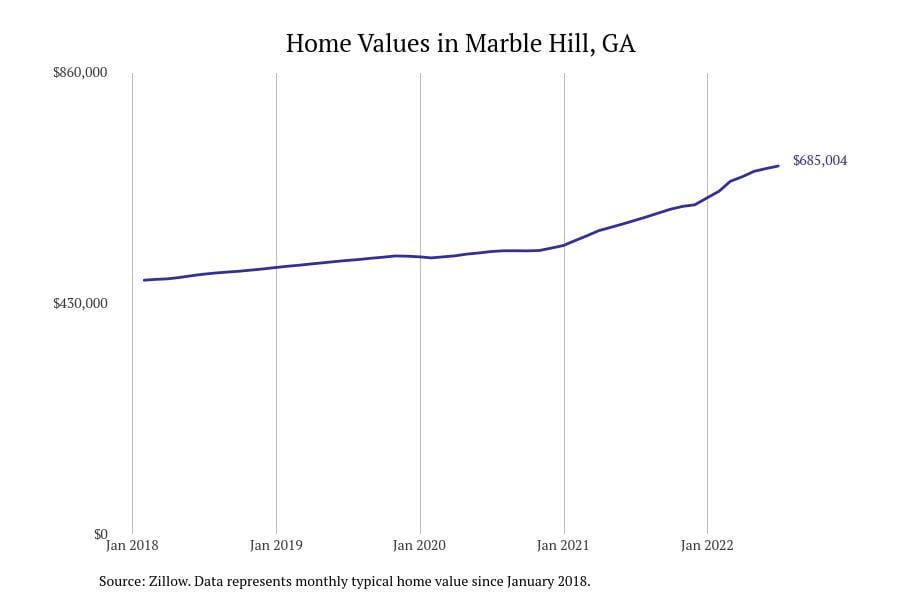
Stacker
#7. Marble Hill
– Typical home value: $685,004
– 1-year price change: +17.4%
– 5-year price change: +49.6%
– Metro area: Atlanta-Sandy Springs-Roswell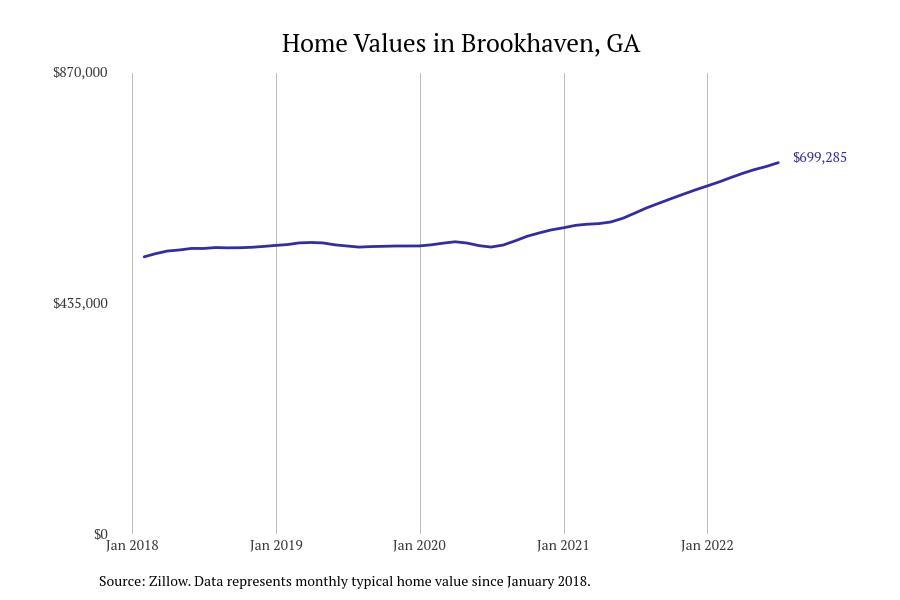
Stacker
#6. Brookhaven
– Typical home value: $699,285
– 1-year price change: +15.7%
– 5-year price change: +41.8%
– Metro area: Atlanta-Sandy Springs-Roswell
You may also like: Best places to raise a family in Georgia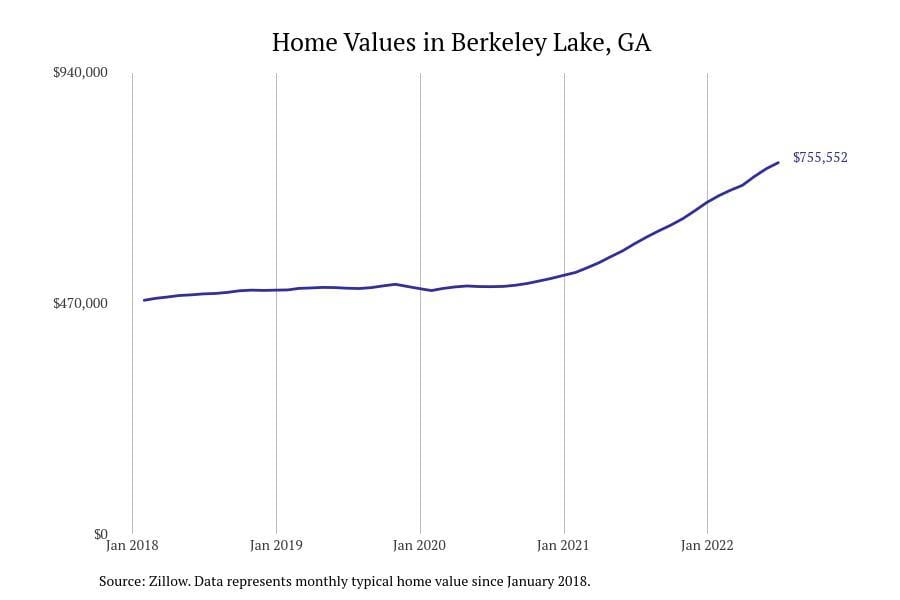
Stacker
#5. Berkeley Lake
– Typical home value: $755,552
– 1-year price change: +27.9%
– 5-year price change: +65.2%
– Metro area: Atlanta-Sandy Springs-Roswell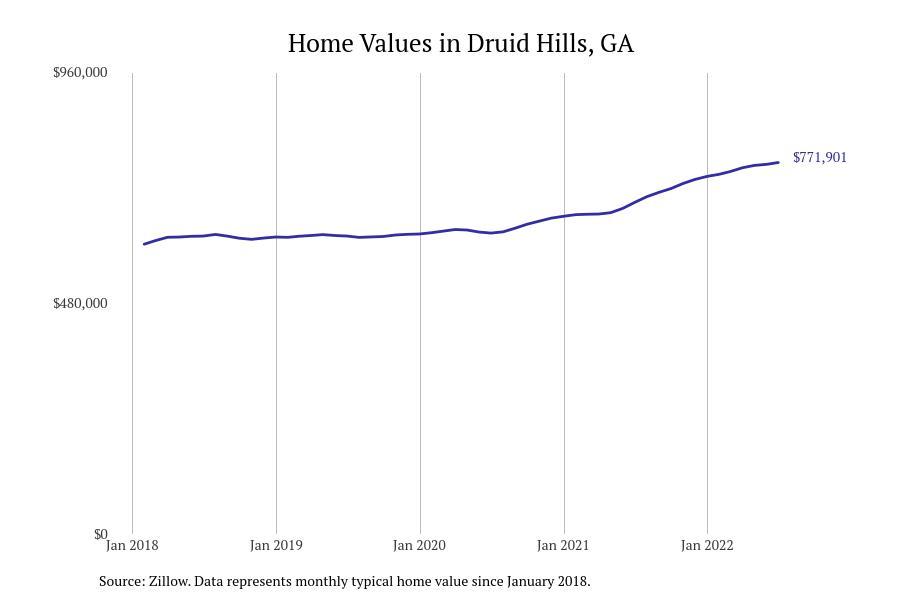
Stacker
#4. Druid Hills
– Typical home value: $771,901
– 1-year price change: +12.0%
– 5-year price change: +34.9%
– Metro area: Atlanta-Sandy Springs-Roswell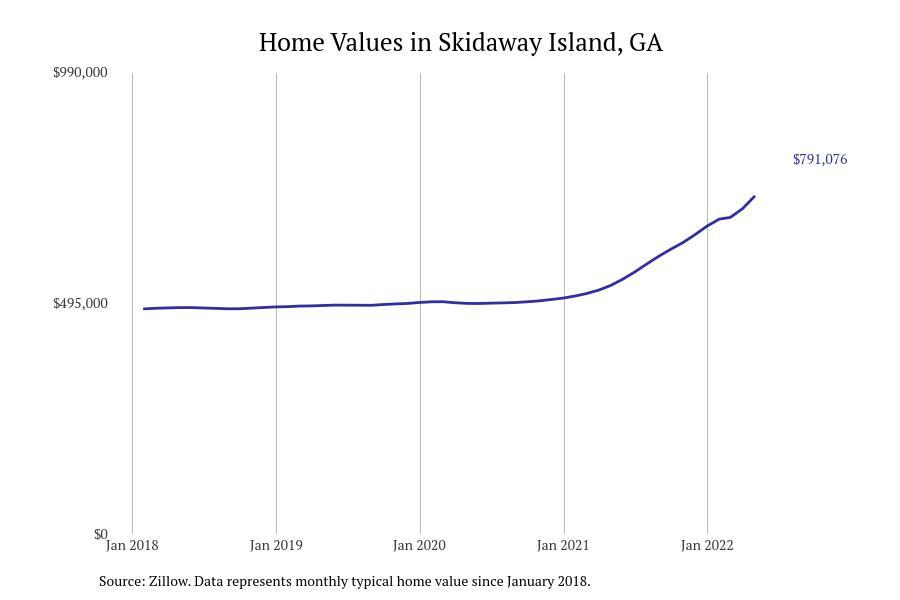
Stacker
#3. Skidaway Island
– Typical home value: $791,076
– 1-year price change: +40.9%
– 5-year price change: +65.5%
– Metro area: Savannah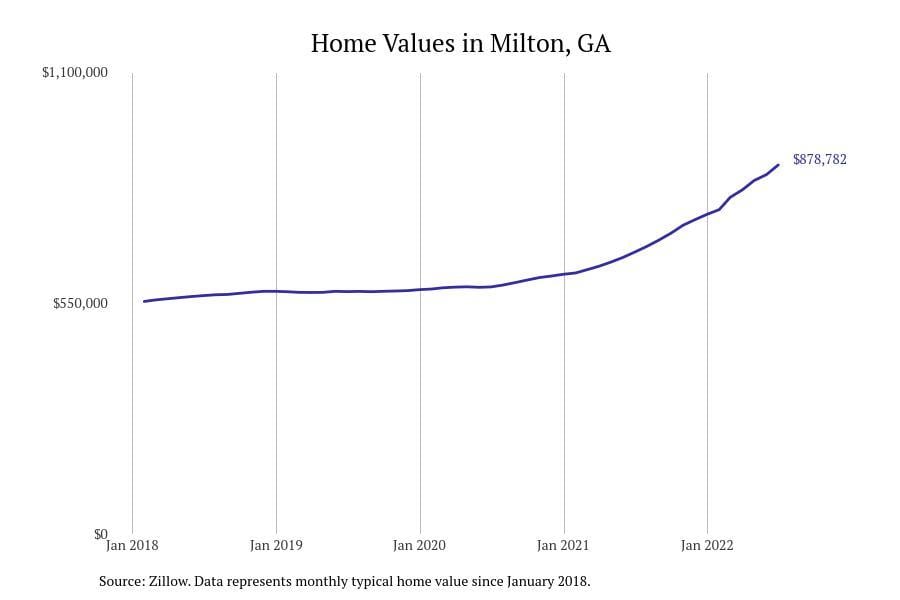
Stacker
#2. Milton
– Typical home value: $878,782
– 1-year price change: +31.0%
– 5-year price change: +62.1%
– Metro area: Atlanta-Sandy Springs-Roswell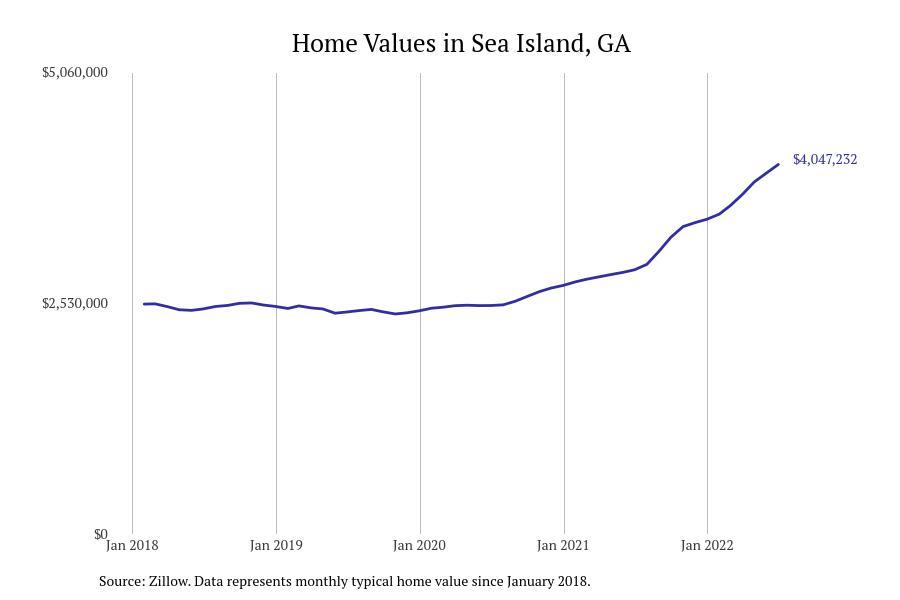
Stacker
#1. Sea Island
– Typical home value: $4,047,232
– 1-year price change: +39.8%
– 5-year price change: +67.8%
– Metro area: Brunswick
You may also like: See how much of its wind energy potential Georgia uses
Get More Context: With the barrage of information coming through your social media feeds and phone notifications, it can be hard to get a clear picture of what’s happening in your community and throughout the state. Click here to see what else is happening in The Peach State and get your news in context instead of relying on social media feeds and notifications for your news. We’ll help you stay informed.
[mailerlite_form form_id=11]