
It goes without saying that the coronavirus pandemic sparked a wave of uncertainty across myriad industries, and no other market has quite felt its impact like that of real estate.
The pandemic became a driving force behind the continued real estate boom, with high demand for vacation homes and a limited supply of housing that prompted buyers and investors to bid up prices for affordable properties, causing home prices to skyrocket. Since then, increasing mortgage rates have slowed growth, with prices even declining in some places. But some areas are still seeing price jumps compared to the year before.
Stacker compiled a list of cities with the fastest-growing home prices in the Albany, GA metro area using data from Zillow. Cities are ranked by 1-year price change as of May 2023. The typical home value in the United States increased over the last year by 0.9% to $346,856. All 13 cities and towns with data available were included in the list.
Stacker
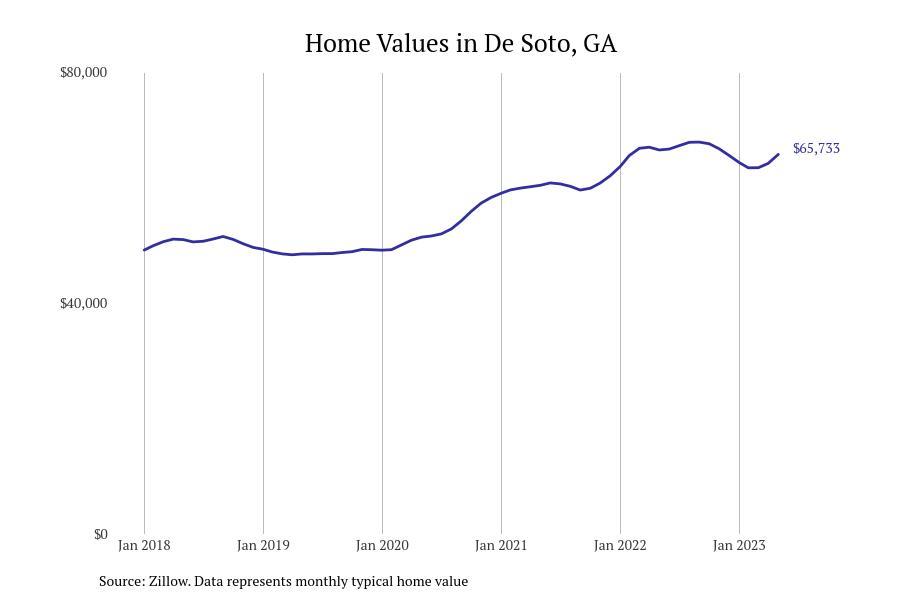
#13. De Soto, GA
– 1-year price change: -$765 (-1.2%)
– 5-year price change: +$14,757 (+28.9%)
– Typical home value: $65,733 (#13 most expensive city in metro)
Stacker
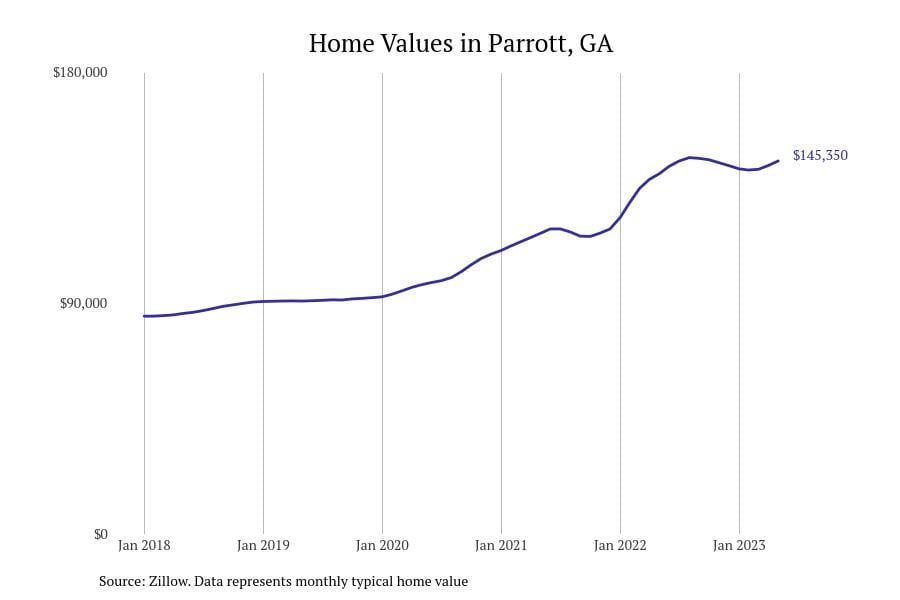
#12. Parrott, GA
– 1-year price change: +$4,970 (+3.5%)
– 5-year price change: +$59,414 (+69.1%)
– Typical home value: $145,350 (#4 most expensive city in metro)
Stacker
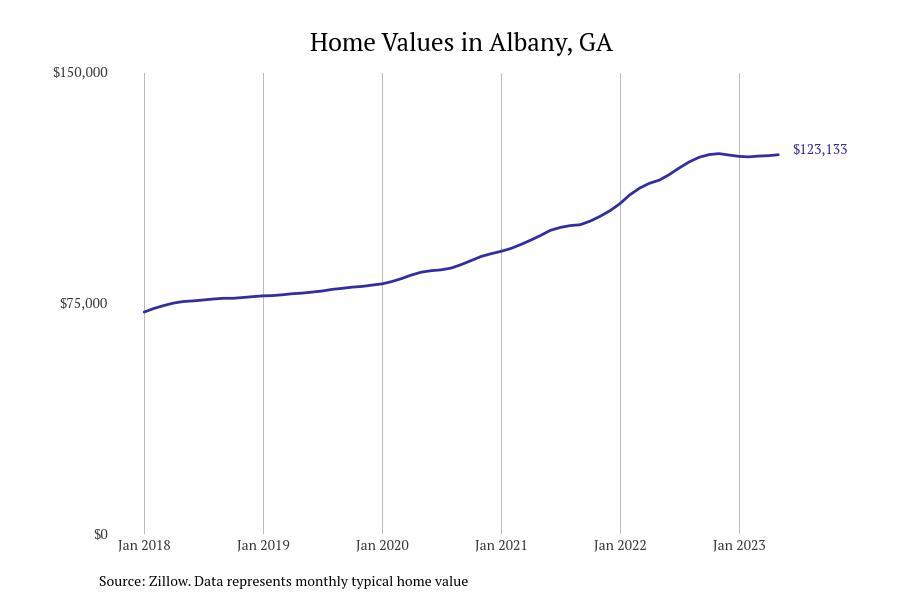
#11. Albany, GA
– 1-year price change: +$8,236 (+7.2%)
– 5-year price change: +$47,648 (+63.1%)
– Typical home value: $123,133 (#8 most expensive city in metro)
Stacker
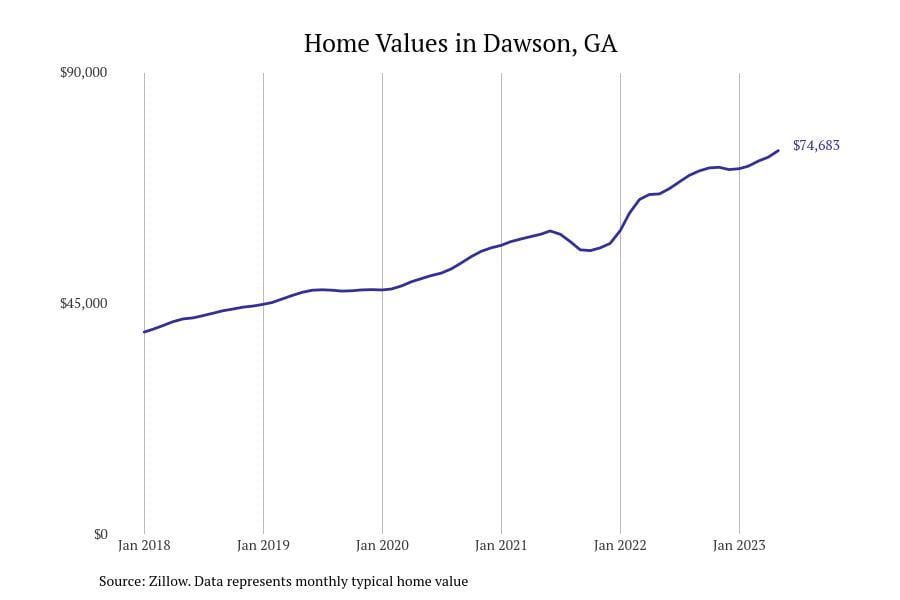
#10. Dawson, GA
– 1-year price change: +$8,433 (+12.7%)
– 5-year price change: +$32,778 (+78.2%)
– Typical home value: $74,683 (#12 most expensive city in metro)
Stacker
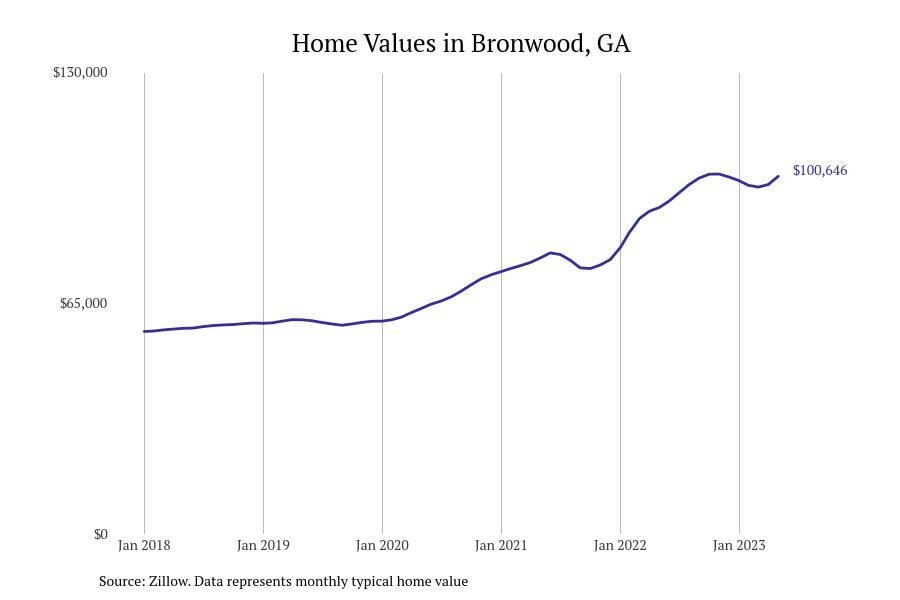
#9. Bronwood, GA
– 1-year price change: +$8,762 (+9.5%)
– 5-year price change: +$42,771 (+73.9%)
– Typical home value: $100,646 (#10 most expensive city in metro)
Stacker
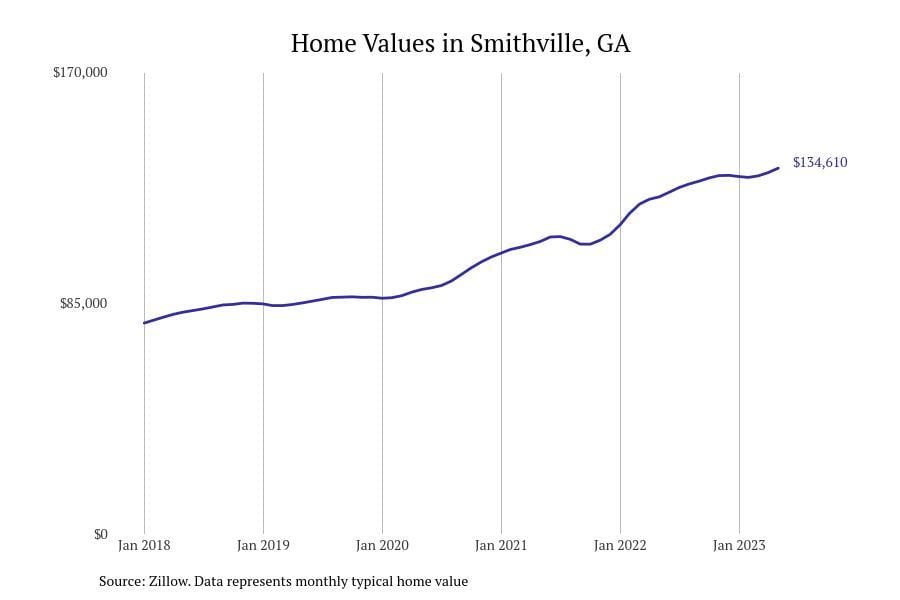
#8. Smithville, GA
– 1-year price change: +$10,547 (+8.5%)
– 5-year price change: +$52,967 (+64.9%)
– Typical home value: $134,610 (#5 most expensive city in metro)
Stacker
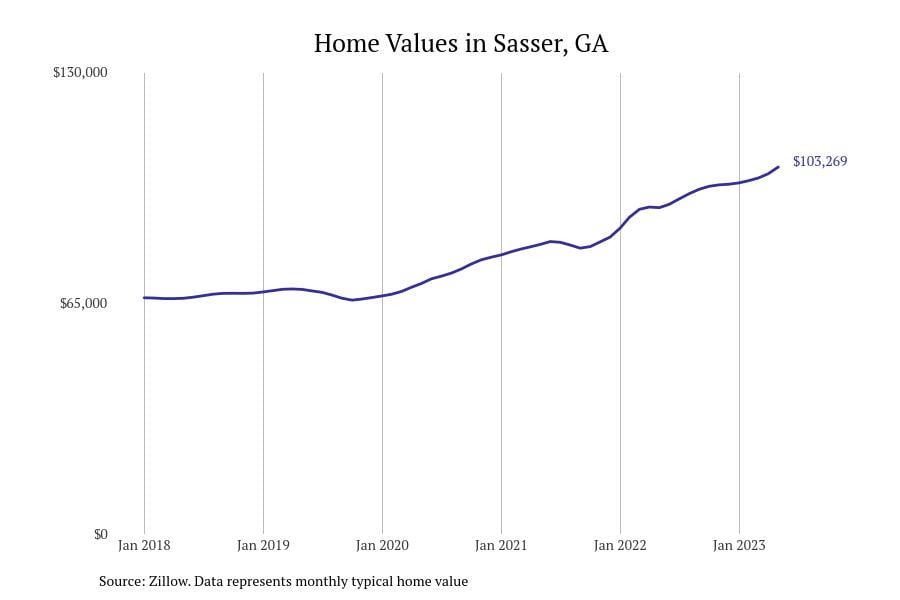
#7. Sasser, GA
– 1-year price change: +$11,439 (+12.5%)
– 5-year price change: +$36,946 (+55.7%)
– Typical home value: $103,269 (#9 most expensive city in metro)
Stacker
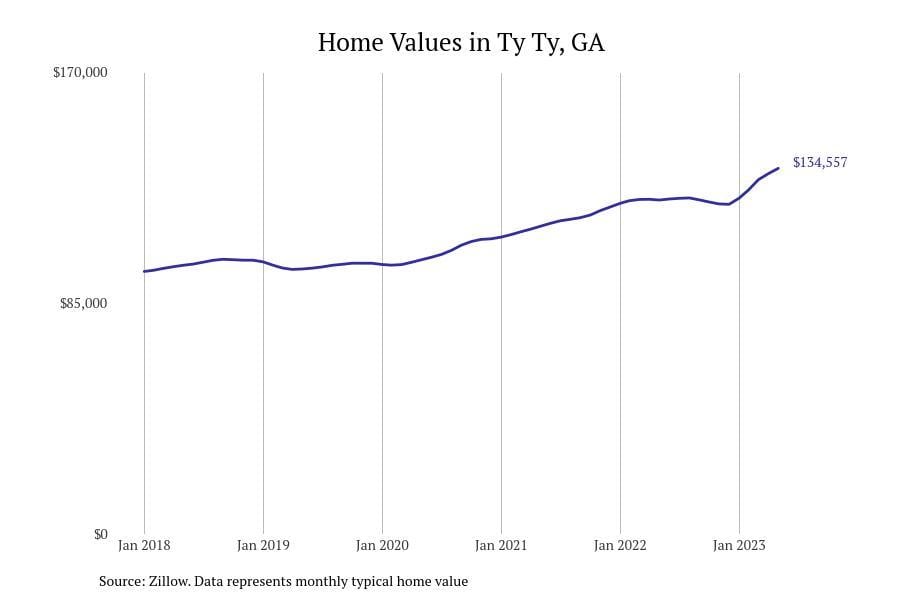
#6. Ty Ty, GA
– 1-year price change: +$11,670 (+9.5%)
– 5-year price change: +$35,672 (+36.1%)
– Typical home value: $134,557 (#6 most expensive city in metro)
Stacker
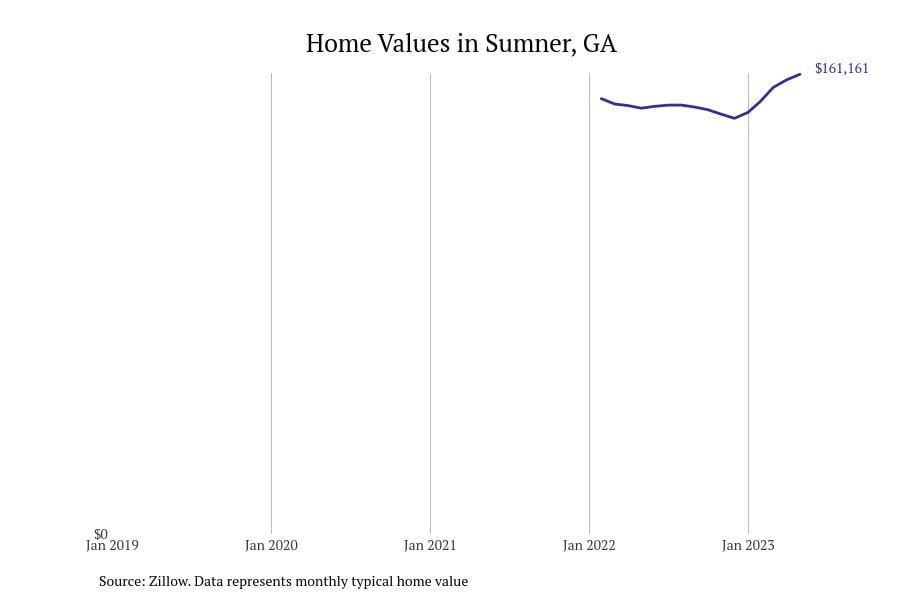
#5. Sumner, GA
– 1-year price change: +$11,912 (+8.0%)
– 5-year price change: +$35,672 (data not available)
– Typical home value: $161,161 (#3 most expensive city in metro)
Stacker
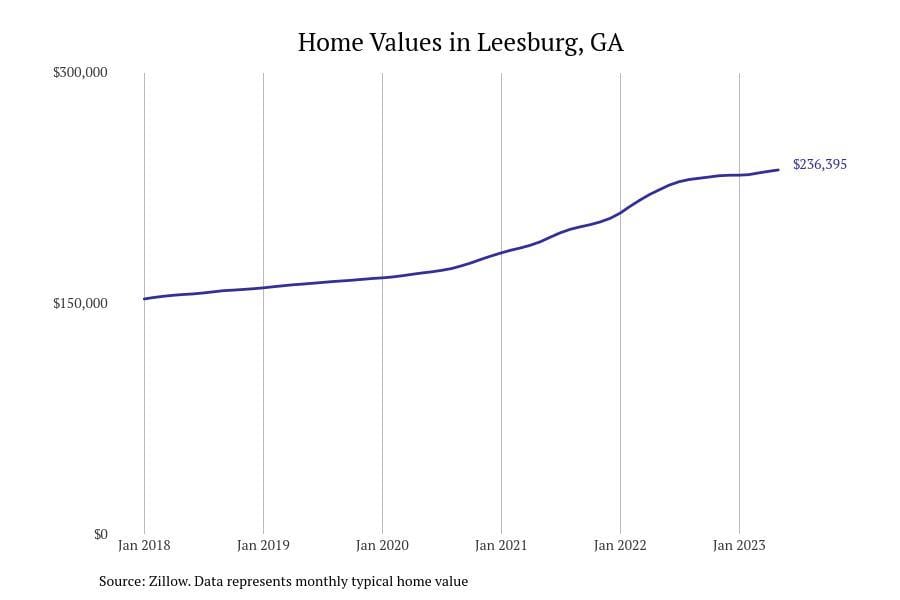
#4. Leesburg, GA
– 1-year price change: +$12,872 (+5.8%)
– 5-year price change: +$80,871 (+52.0%)
– Typical home value: $236,395 (#2 most expensive city in metro)
Stacker
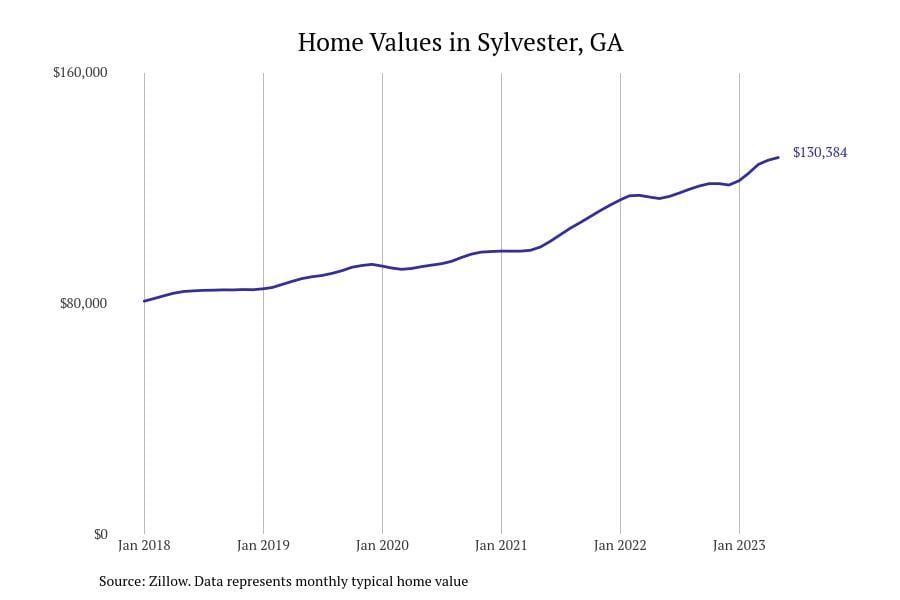
#3. Sylvester, GA
– 1-year price change: +$14,215 (+12.2%)
– 5-year price change: +$46,413 (+55.3%)
– Typical home value: $130,384 (#7 most expensive city in metro)
Stacker
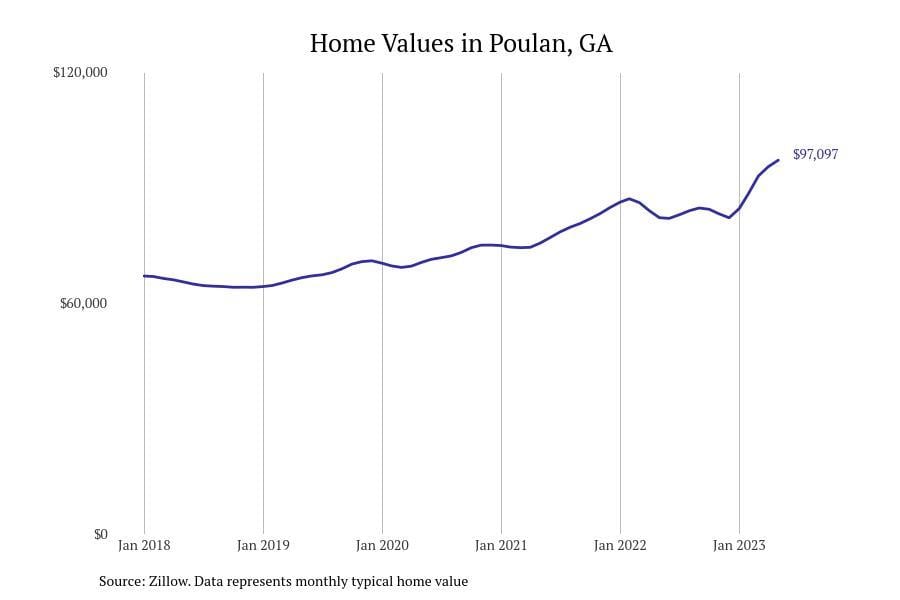
#2. Poulan, GA
– 1-year price change: +$14,938 (+18.2%)
– 5-year price change: +$31,610 (+48.3%)
– Typical home value: $97,097 (#11 most expensive city in metro)
Stacker
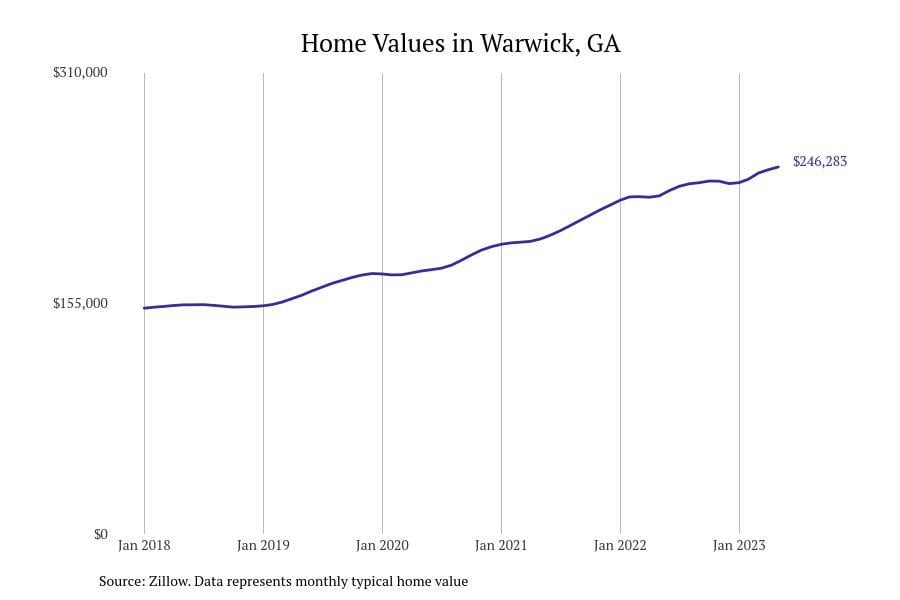
#1. Warwick, GA
– 1-year price change: +$19,383 (+8.5%)
– 5-year price change: +$92,522 (+60.2%)
– Typical home value: $246,283 (#1 most expensive city in metro)