Several factors contribute to cancer rates, from personal habits and genetics to air pollution or groundwater quality in a given area. People experiencing social, economic, or environmental disadvantages are disproportionately affected by high cancer rates in certain regions—including access or barriers to early screening and care.
Cancer rates also fluctuate by jobs: Higher rates of cancer can be found among meat industry and rubber manufacturing workers, and farmers.
Stacker compiled the counties with the highest cancer rates in Georgia using data from the CDC. Keep reading to see where in your state cancer cases are the most common.

Canva
#50. Thomas County
– Cancer rate per 100,000, 2016-2020: 638.5
– Age-adjusted rate per 100,000, 2016-2020: 489.8

Canva
#49. Heard County
– Cancer rate per 100,000, 2016-2020: 641.5
– Age-adjusted rate per 100,000, 2016-2020: 499.4

JFFC // Shutterstock
#48. Lamar County
– Cancer rate per 100,000, 2016-2020: 643.5
– Age-adjusted rate per 100,000, 2016-2020: 513.2

Canva
#47. Monroe County
– Cancer rate per 100,000, 2016-2020: 646.1
– Age-adjusted rate per 100,000, 2016-2020: 466.3

Williams Photography 365 // Shutterstock
#46. Hart County
– Cancer rate per 100,000, 2016-2020: 646.6
– Age-adjusted rate per 100,000, 2016-2020: 436.6
Canva
#45. Clay County
– Cancer rate per 100,000, 2016-2020: 648.3
– Age-adjusted rate per 100,000, 2016-2020: 393.7
Canva
#44. Sumter County
– Cancer rate per 100,000, 2016-2020: 651.6
– Age-adjusted rate per 100,000, 2016-2020: 532.9
Georges_Creations // Shutterstock
#43. Spalding County
– Cancer rate per 100,000, 2016-2020: 652.6
– Age-adjusted rate per 100,000, 2016-2020: 504.4
Canva
#42. Upson County
– Cancer rate per 100,000, 2016-2020: 653.3
– Age-adjusted rate per 100,000, 2016-2020: 472.3

Canva
#41. McIntosh County
– Cancer rate per 100,000, 2016-2020: 655.6
– Age-adjusted rate per 100,000, 2016-2020: 374.3
Canva
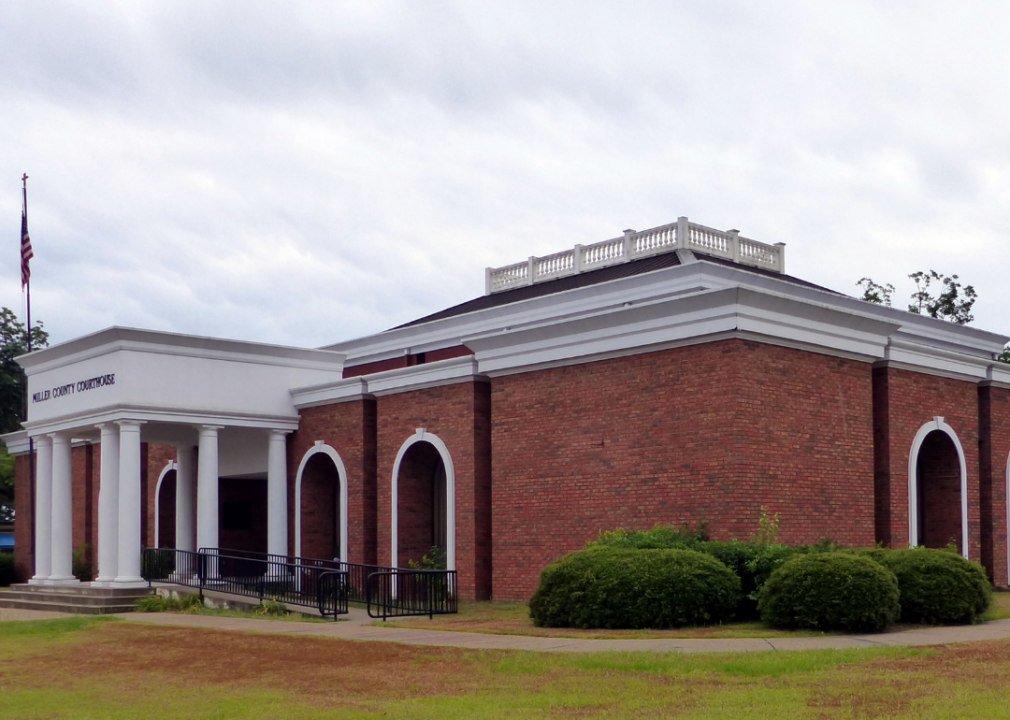
#40. Miller County
– Cancer rate per 100,000, 2016-2020: 656.7
– Age-adjusted rate per 100,000, 2016-2020: 462.2
Canva
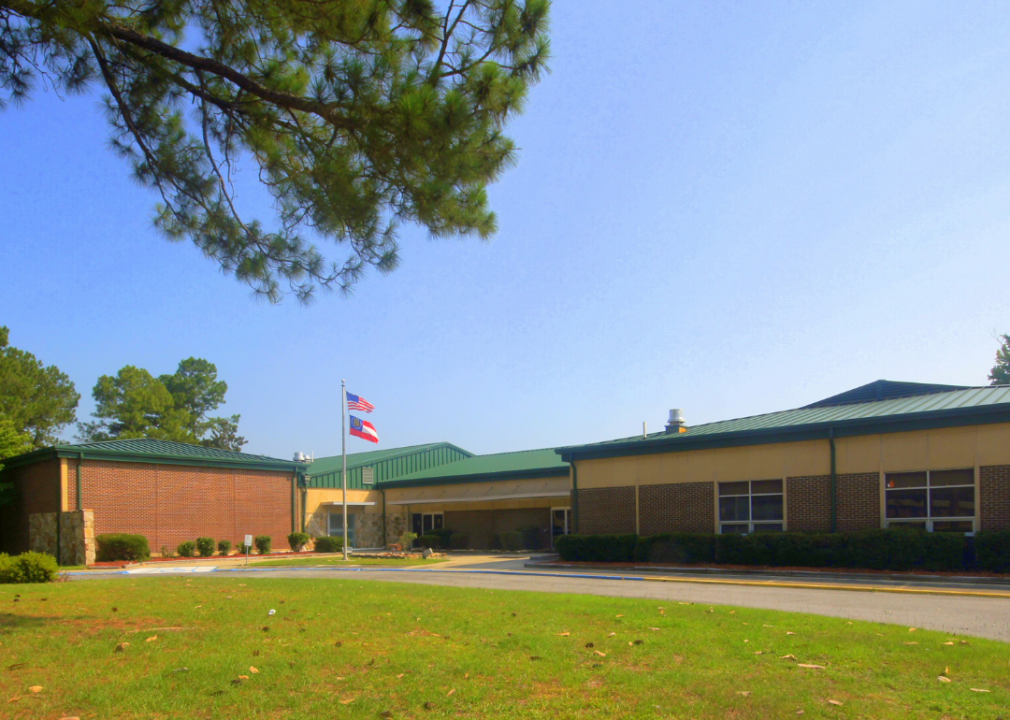
#39. Screven County
– Cancer rate per 100,000, 2016-2020: 656.8
– Age-adjusted rate per 100,000, 2016-2020: 464.2

Canva
#38. Jones County
– Cancer rate per 100,000, 2016-2020: 656.8
– Age-adjusted rate per 100,000, 2016-2020: 507.2

Sean Pavone // Shutterstock
#37. Madison County
– Cancer rate per 100,000, 2016-2020: 656.9
– Age-adjusted rate per 100,000, 2016-2020: 503.3
Roberto Galan // Shutterstock
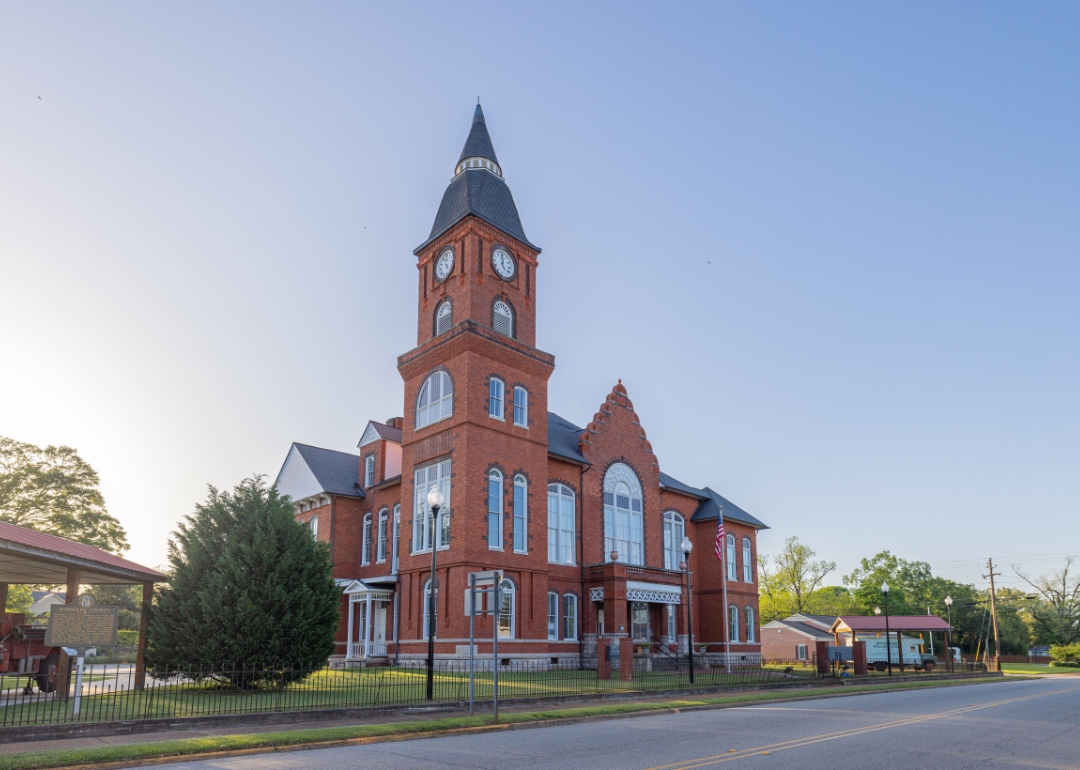
#36. Randolph County
– Cancer rate per 100,000, 2016-2020: 659.2
– Age-adjusted rate per 100,000, 2016-2020: 424.9

Canva
#35. Dawson County
– Cancer rate per 100,000, 2016-2020: 665.4
– Age-adjusted rate per 100,000, 2016-2020: 457.4
Canva
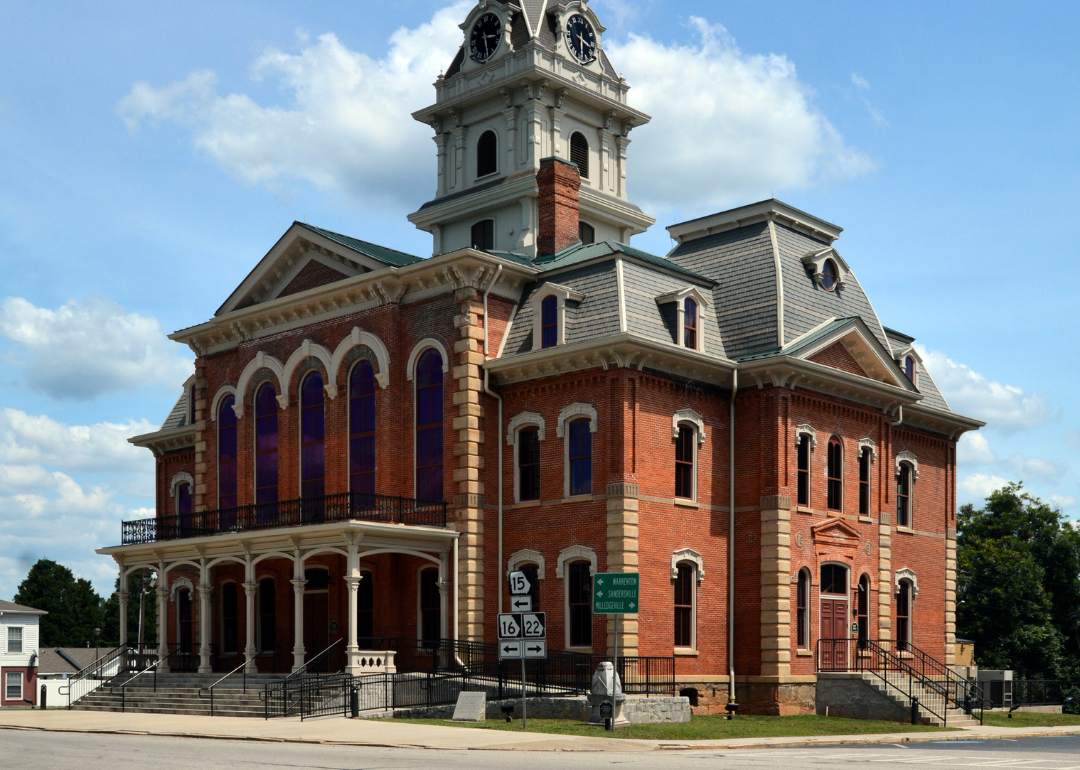
#34. Hancock County
– Cancer rate per 100,000, 2016-2020: 668.2
– Age-adjusted rate per 100,000, 2016-2020: 413.4

Canva
#33. Meriwether County
– Cancer rate per 100,000, 2016-2020: 673.6
– Age-adjusted rate per 100,000, 2016-2020: 465.0

Canva
#32. Worth County
– Cancer rate per 100,000, 2016-2020: 674.3
– Age-adjusted rate per 100,000, 2016-2020: 490.8

Canva
#31. Franklin County
– Cancer rate per 100,000, 2016-2020: 674.3
– Age-adjusted rate per 100,000, 2016-2020: 501.6

Canva
#30. Habersham County
– Cancer rate per 100,000, 2016-2020: 675.2
– Age-adjusted rate per 100,000, 2016-2020: 523.9
Wirestock Creators // Shutterstock
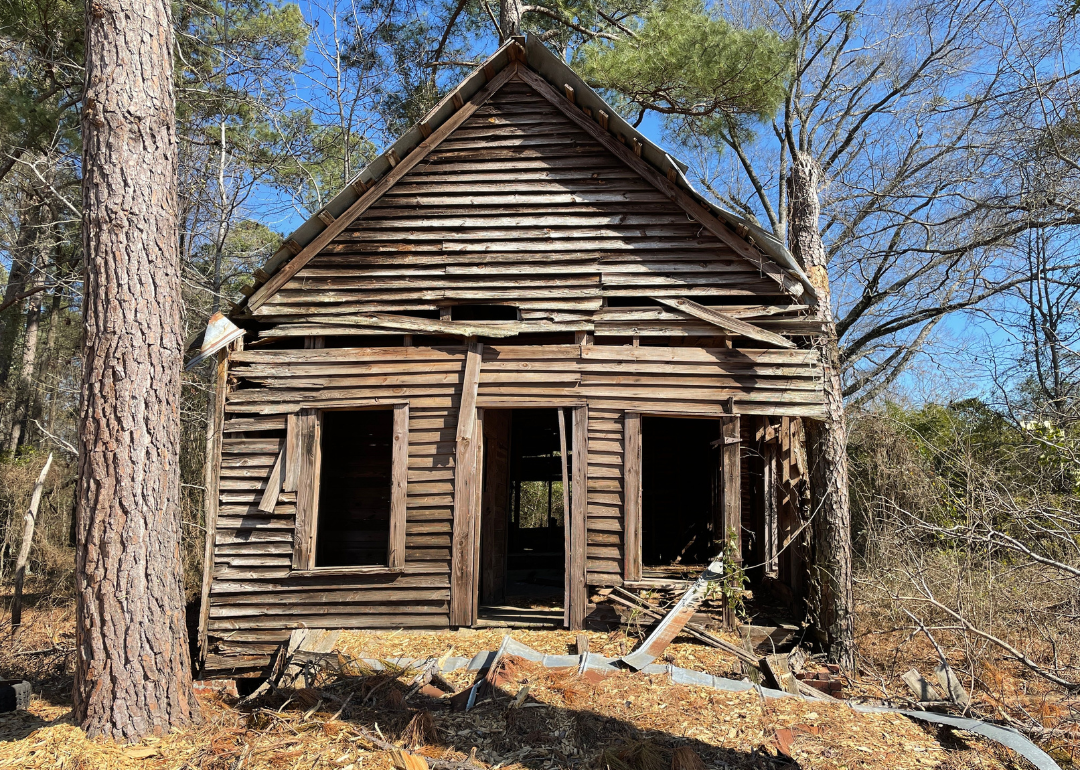
#29. Jefferson County
– Cancer rate per 100,000, 2016-2020: 677.9
– Age-adjusted rate per 100,000, 2016-2020: 505.7

SevenMaps // Shutterstock
#28. Wilkinson County
– Cancer rate per 100,000, 2016-2020: 686.4
– Age-adjusted rate per 100,000, 2016-2020: 482.7

Canva
#27. Oglethorpe County
– Cancer rate per 100,000, 2016-2020: 687.5
– Age-adjusted rate per 100,000, 2016-2020: 501.2
Canva
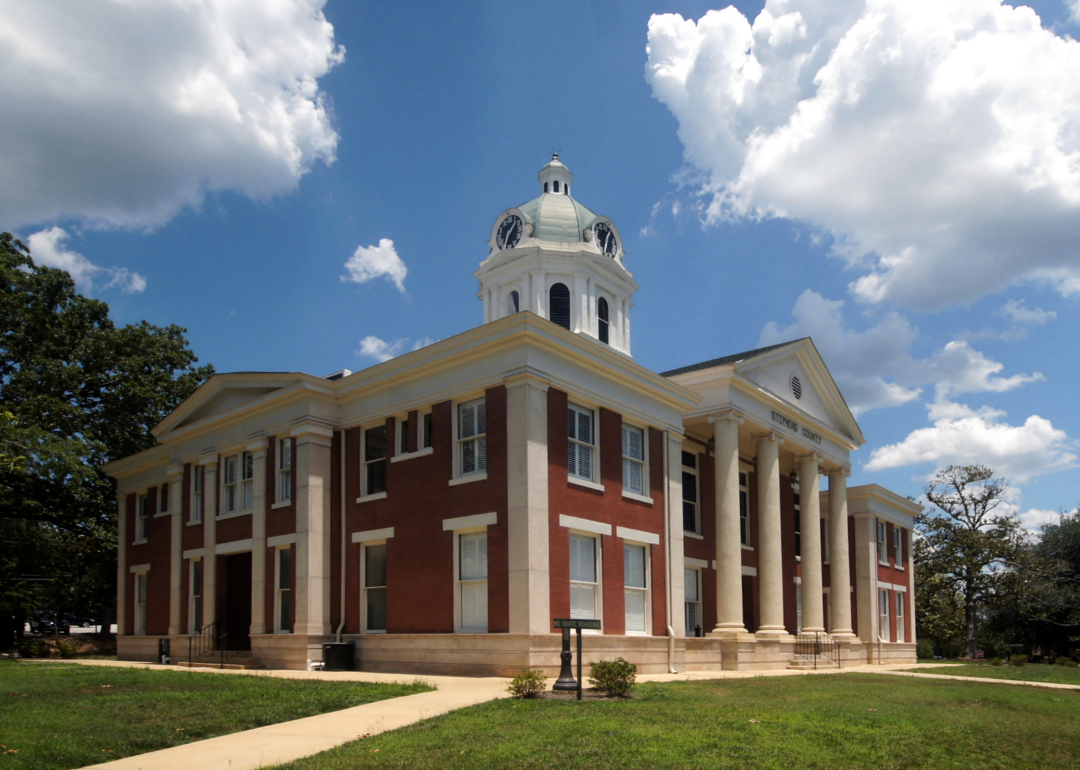
#26. Stephens County
– Cancer rate per 100,000, 2016-2020: 693.3
– Age-adjusted rate per 100,000, 2016-2020: 511.0

Canva
#25. Morgan County
– Cancer rate per 100,000, 2016-2020: 695.7
– Age-adjusted rate per 100,000, 2016-2020: 494.6
Canva
#24. Crawford County
– Cancer rate per 100,000, 2016-2020: 697.8
– Age-adjusted rate per 100,000, 2016-2020: 479.4

Nick Fox // Shutterstock
#23. Brooks County
– Cancer rate per 100,000, 2016-2020: 701.1
– Age-adjusted rate per 100,000, 2016-2020: 508.6

Canva
#22. Jasper County
– Cancer rate per 100,000, 2016-2020: 721.9
– Age-adjusted rate per 100,000, 2016-2020: 536.1
Roberto Galan // Shutterstock
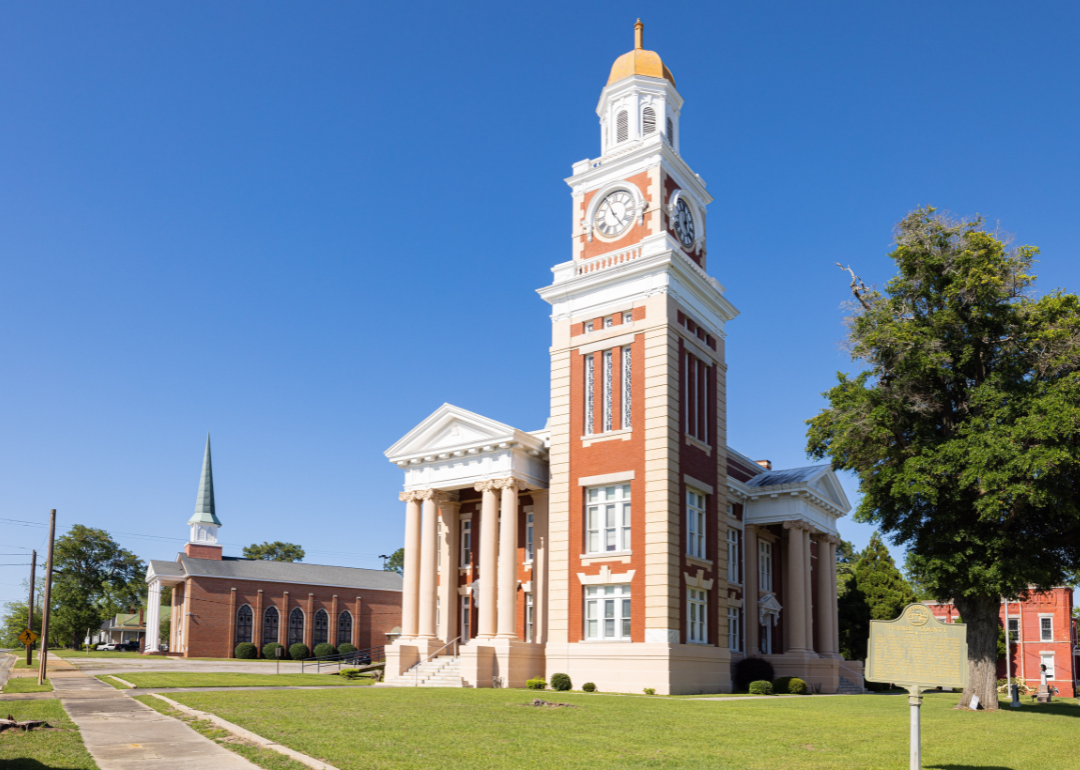
#21. Turner County
– Cancer rate per 100,000, 2016-2020: 722.2
– Age-adjusted rate per 100,000, 2016-2020: 548.2
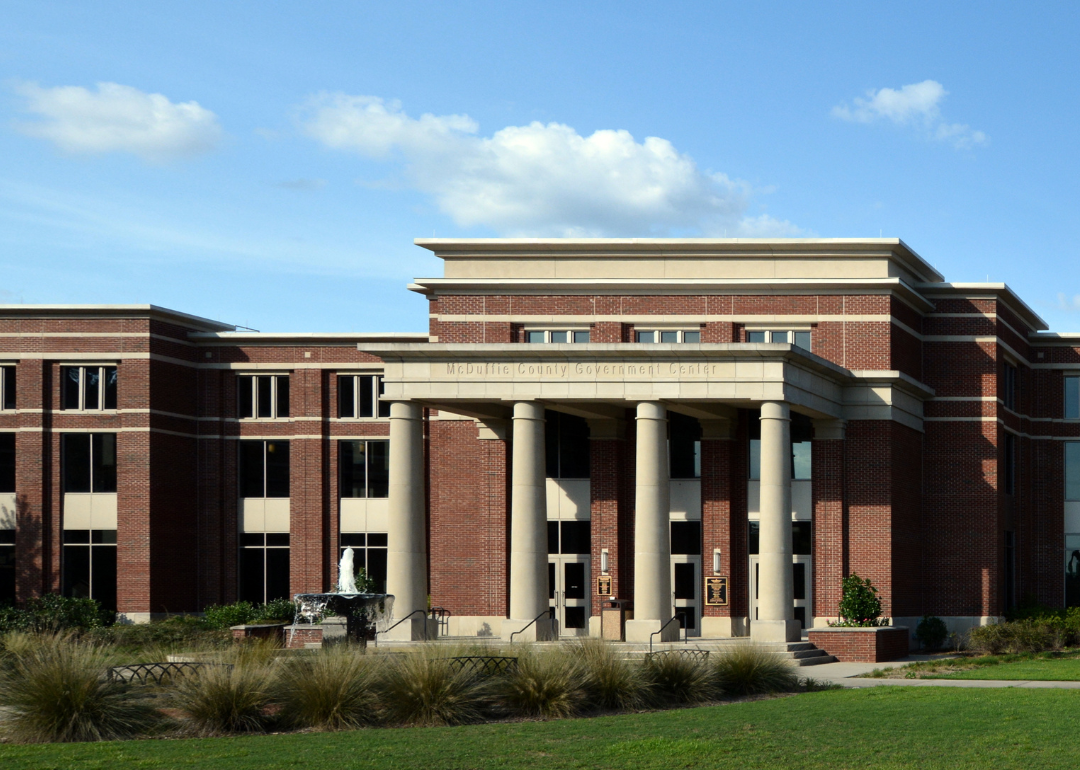
Canva
#20. McDuffie County
– Cancer rate per 100,000, 2016-2020: 729.8
– Age-adjusted rate per 100,000, 2016-2020: 566.3

Canva
#19. White County
– Cancer rate per 100,000, 2016-2020: 734.9
– Age-adjusted rate per 100,000, 2016-2020: 485.9

Roberto Galan // Shutterstock
#18. Webster County
– Cancer rate per 100,000, 2016-2020: 742.1
– Age-adjusted rate per 100,000, 2016-2020: 466.7

Canva
#17. Wilkes County
– Cancer rate per 100,000, 2016-2020: 743.1
– Age-adjusted rate per 100,000, 2016-2020: 469.7

Canva
#16. Putnam County
– Cancer rate per 100,000, 2016-2020: 744.1
– Age-adjusted rate per 100,000, 2016-2020: 467.6

Canva
#15. Elbert County
– Cancer rate per 100,000, 2016-2020: 748.3
– Age-adjusted rate per 100,000, 2016-2020: 523.6

Tony Cantrell // Shutterstock
#14. Talbot County
– Cancer rate per 100,000, 2016-2020: 759.0
– Age-adjusted rate per 100,000, 2016-2020: 448.1

Canva
#13. Rabun County
– Cancer rate per 100,000, 2016-2020: 769.9
– Age-adjusted rate per 100,000, 2016-2020: 443.0
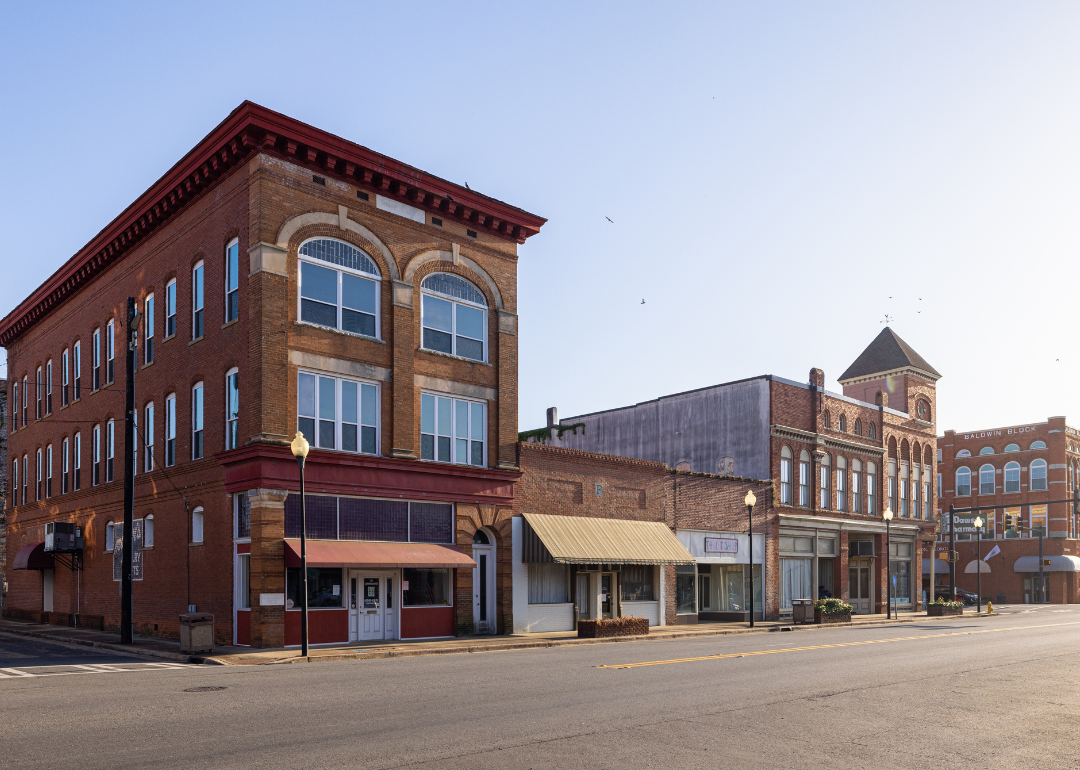
Roberto Galan // Shutterstock
#12. Terrell County
– Cancer rate per 100,000, 2016-2020: 776.6
– Age-adjusted rate per 100,000, 2016-2020: 554.0

Canva
#11. Lincoln County
– Cancer rate per 100,000, 2016-2020: 781.9
– Age-adjusted rate per 100,000, 2016-2020: 469.3

Canva
#10. Taliaferro County
– Cancer rate per 100,000, 2016-2020: 792.6
– Age-adjusted rate per 100,000, 2016-2020: 439.4
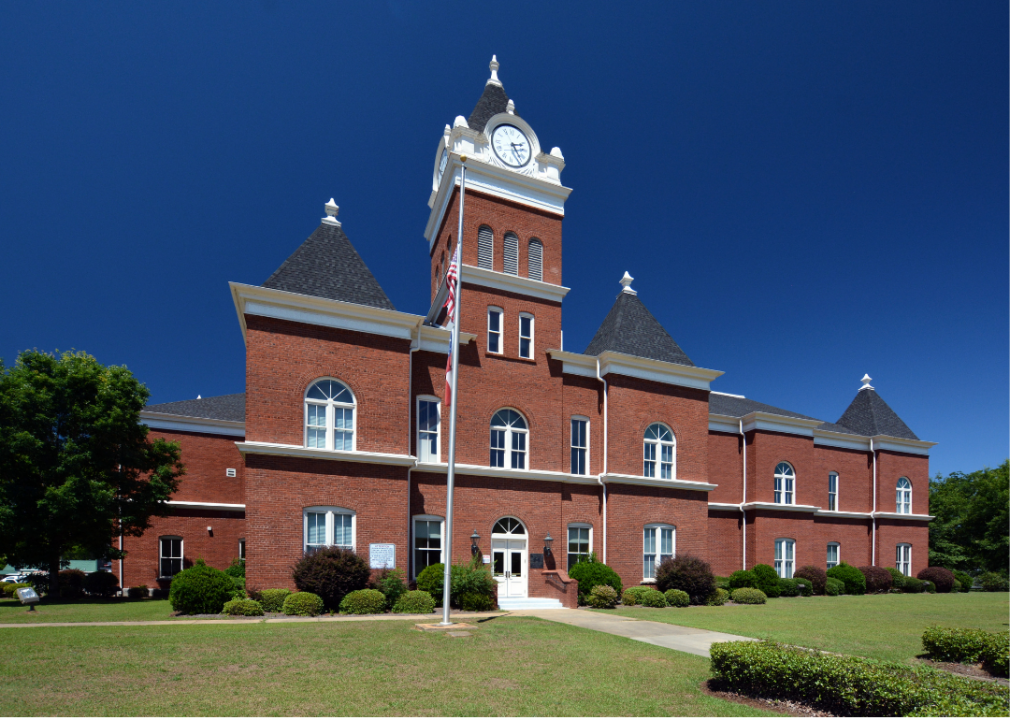
Canva
#9. Twiggs County
– Cancer rate per 100,000, 2016-2020: 793.1
– Age-adjusted rate per 100,000, 2016-2020: 518.1

Canva
#8. Gilmer County
– Cancer rate per 100,000, 2016-2020: 822.3
– Age-adjusted rate per 100,000, 2016-2020: 498.6

Canva
#7. Warren County
– Cancer rate per 100,000, 2016-2020: 825.2
– Age-adjusted rate per 100,000, 2016-2020: 518.8
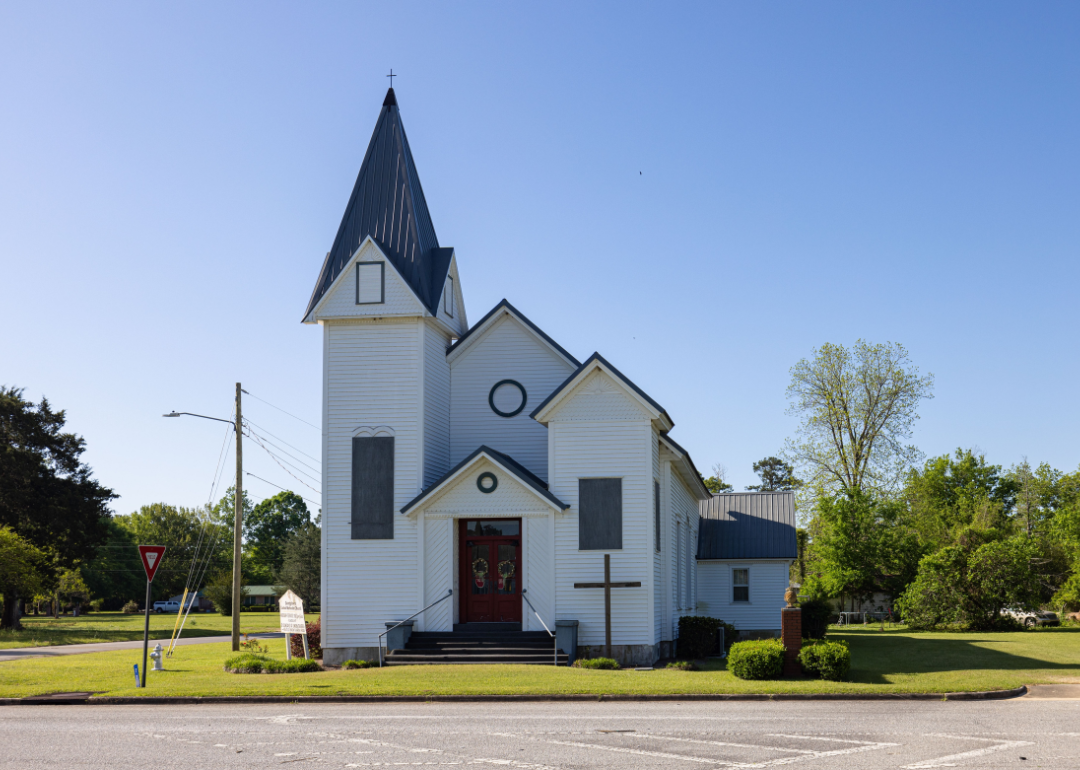
Roberto Galan // Shutterstock
#6. Quitman County
– Cancer rate per 100,000, 2016-2020: 862.2
– Age-adjusted rate per 100,000, 2016-2020: 442.5

RodClementPhotography // Shutterstock
#5. Pickens County
– Cancer rate per 100,000, 2016-2020: 866.8
– Age-adjusted rate per 100,000, 2016-2020: 575.3

Canva
#4. Fannin County
– Cancer rate per 100,000, 2016-2020: 885.4
– Age-adjusted rate per 100,000, 2016-2020: 476.3

Canva
#3. Greene County
– Cancer rate per 100,000, 2016-2020: 891.7
– Age-adjusted rate per 100,000, 2016-2020: 496.8

Canva
#2. Union County
– Cancer rate per 100,000, 2016-2020: 927.5
– Age-adjusted rate per 100,000, 2016-2020: 448.2

Canva
#1. Towns County
– Cancer rate per 100,000, 2016-2020: 1,068.2
– Age-adjusted rate per 100,000, 2016-2020: 524.8

